Book Review-The Climate Book by Greta Thunberg

In 2097, on the 100th anniversary of the Kyoto Protocol, historians will ask why did we not do something to prevent the warming of the planet.  After all, we experienced record breaking temperatures every year, were the most educated population in world history, and had the technology and economic resources to reduce carbon emissions. They will likely establish an historical argument based on our obsession with laissez-faire economics and consumer spending.

Will the people at the beginning of the 21st century blame the scientists, economists, and politicians or will they blame misinformation, self-interest, and neglect of spiritual perspective? Fortunately, there is substantial evidence to support the contributions of the government, business, and educational leaders from New Jersey and New York in addressing the crisis of climate that has already defined the 21st century.

Greta Thunberg’s The Climate Book is a collection of articles that future historians will read in their inquiry into the decisions of the top 1% of the population of the “Global North” and everyone else with a net worth over $1 million in 2026. The data will serve as evidence of how we abused carbon.  In 1900- the cumulative carbon emissions totaled 45 billion tons and in 2000 it was1,000 gigatons. In 2026, it doubled to 2,000 gigatons. (Page 14) The question on the 2097 AP World History exam will be, “Why?”

This book is the “go to” book for educators.  Climate education is relevant to history, science, economics, sociology, literature, art, math, and civics. The problem of climate cannot be debated as there is no place for compromise. Greta Thunberg’s analogy made this clear to me:

“It is like walking on thin ice – either it carries your weight, or it does not. Either you make it to the shore, or you fall into the deep dark, cold waters.” (page 2)

Teachers are the first responders who need to make students aware by teaching the importance of sustainability, understanding that the economic freedom we value is changing our environment, that the problem with carbon is one of chemistry and physics. The slightest increase in temperature changes the composition of oceans and our atmosphere. According to Thuberg, since most political and business leaders are not able to address the problem; the collective action of the global population is our best hope. This is why teachers and curriculum matter!

The book is organized into five sections with concise articles of three or four pages explaining and analyzing the theme of each section. Each article provides excellent information for discussion, further exploration, and cooperative learning.  For example, Section 2, “How Our Planet is Changing”, includes articles on heat, methane, air pollution, clouds, the jet stream, polar ice caps, acidification, droughts, floods, fresh water, and microplastics. These articles explain the fragile nature of our atmosphere, how small changes over time lead to major changes in food production, and the economic and human cost of extreme weather events.

“A new line of research has also uncovered a summer connection that contributes to recent severe heatwaves, wildfires, droughts and deluges.  These extreme events are more likely when the jet stream splits, with one branch flowing across the middle of the continent and another along the Arctic coast.  These splits tend to occur when the spring snow cover on high-latitude land areas melts earlier than normal, a strong trend observed in recent decades.  When the snow disappears early, underlying soils dry out and warm sooner, creating a belt of abnormally high temperatures over high latitude land areas.  This warm belt favors jet-stream splits. Rossby waves can then become trapped between the two jet-stream branches, causing stagnant weather conditions that can cause persistent heatwaves, dry periods and rain spells, often leading to extreme summer events.” (Page 65)

If all the ice in Greenland and Antarctica melt, sea levels have the potential to rise by 65 meters or 200 feet. (page 83)  According to the New Jersey Department of Environmental Protection, “As identified in the New Jersey’s Rising Seas and Changing Coastal Storms: Report of the Science and Technical Advisory Panel and the New Jersey Scientific Report on Climate Change, sea-levels are increasing at a greater rate in New Jersey than other parts of the world. By 2050, it is likely that sea-level rise will meet or exceed 1.7 feet and increase to 3.8 feet by the end of the century. “Sunny day flooding” will occur more often across the entire coastal area with Atlantic City experiencing “sunny day flooding” 131 days a year and a 50% chance it will experience 326 days a year by 2100.”  (A sea level rise of 1.7 feet is less than one meter.) Source

Every article in Chapter 3, “How It Affects US” explicitly documents the reality of climate change. Here are some examples:

“Up to one fifth of the global land surface was affected by extreme drought in 2020, leading to a stark rise in food and water shortages.” (page 134)

“Anthropogenic climate change is responsible for one in three deaths due to heat today – accounting for 37 percent of heat-related deaths between 1991 and 2018.” (page 137)

“Malaria and dengue may spread into temperate areas such as France, Bulgaria, Hungary, Germany and the eastern coast of the Ununited states extending from south of Atlanta to north of Boston.” (page 245)

“We grew crops at a carbon dioxide concentration of 550 parts per million (ppm), the level the world is expected to reach around the middle of this century.  We found that crops grown at these elevated CO2 concentrations had significantly lower amounts of iron, zinc and protein than identical cultivators of those crops grown at today’s CO2 levels.” (page 149)

“The fact that 3 billion people use less energy, on an annual per capita basis, than a standard American refrigerator gives you an idea of how far away from global equity and climate justice we currently are.” (page 154)

“With current warming trends, 1.2 billion people could be forced to migrate by 2050.” (page 180)

The content in this chapter relating to disappearing insects, deforestation, rising sea levels, psychology of violence related to temperature increases, and political instability should be considered as essential reading. Although our goal is to keep temperatures below 1.50C in this century, Greta Thunberg explains that this is an average and some areas will see up to 4.0oC temperatures and others closer to 10C. “In 2021, Moody Analytics estimated that the global economic toll of 20C of warming would be $69 trillion.” (page 192)

Chapter 4 provided me with valuable insights that I can use as a social studies teacher.  These insights provide information on the changes in carbon emissions between 1970 and 2025 and how consumption in OECD countries is contributing to the coming crisis on our planet. The information in this section is also important if individuals are going to educate the adult population. The population of the United States is in denial about what is happening and the fact that in approximately 20 years, 1.5 billion people will need to relocate to a different location within the United States as a result of water shortages, transportation costs, rising sea levels, crop failures, dangerous insects, extreme heat, and unprecedented storms! The target of a 1.5oC increase by 2050 is likely unattainable and we need to expect an average temperature increase of 2.5oC or higher by 2100.  While civic engagement by individuals and families is important, the hope for the future will require action by local, state, and national governments.

“The carbon dioxide safety level for such climate stability is often considered to be around 350 parts per million (ppm) – a  level we passed in around 1987. In February 2022, we surpassed 421 ppm. At current emission levels, our remaining carbon budgets for a decent change of staying below 1.5oC and, by doing so, minimizing the risk of setting off irreversible chain reactions beyond human control, will be gone before the end of this decade. There are no effective policies in place.” (page 241)

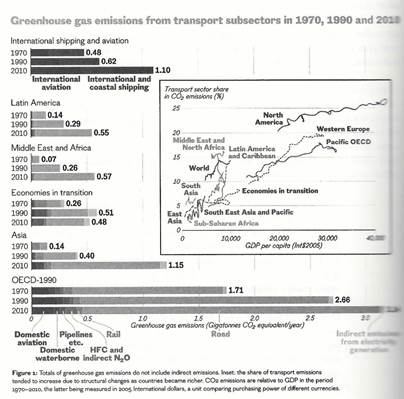
The complexity of the problem is difficult to understand. As populations increase, food production requires more land for agricultural production. As a result species migrate, trees are removed, fertilizer production increases, and the shipping of food to where the people are living increases. The two graphs below include significant data.  The first graph, “Greenhouse gas emissions from transport subsectors in 1970, 1990, and 2010” provides evidence on the increase in emissions as the population of the world increased from approximately 3 billion in 1970 to 8 billion today. The graph also provides evidence of the problem of global equity as the amount of emissions in 2010 is that to the total emissions from Latin America, Middle East and Africa, and Asia total 2.75 gigatons is less than the amount of 3.14 gigatons emitted from the 38 OECD countries with market-based economies and democratic forms of government.
(page 266)

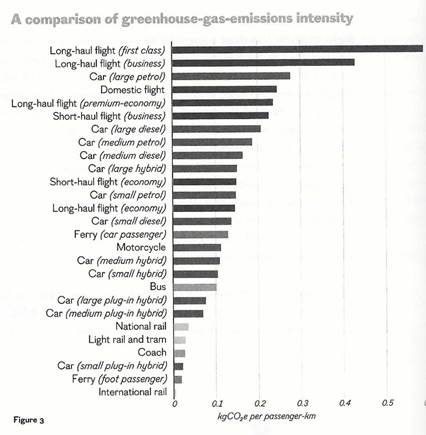
The second graph, “A comparison of greenhouse-gas-emissions intensity”, illustrates the emissions from airplanes, automobiles, and trains. The graph does not include the cost of international shipping, a decision made by the Kyoto Protocol in 1997. “This is extremely problematic since international aviation and shipping together contribute the equivalent amount of CO2 as Japan, the fifth biggest CO2-emitting nation in the world.” (page 269)

The greenhouse gas emissions form airplanes is greater than the emissions from automobiles.  Students need to understand the paradox of buying an EV or hybrid vehicle for transportation to reduce carbon emissions and then taking a plane to the Caribbean for Spring Break or a trip to Europe is counterproductive. We need to change our behavior. Education has the potential to change behavior!
(page 267)

Perhaps the most important insight for me in this section was the information on consumerism. A household in the United States contains, on average, 300,000 individual items,…” (page 282)  Teachers need to bring awareness about human behavior and the impact of production and disposal, and life expectancy and efficiency.

“An American one-percenter accounts for ten times the greenhouse gas emissions of the average American; the average American is responsible for three times the emissions of the average person in France; the average French person accounts for ten times that of the typical person in Bangladesh.” (page 282)  This section provides perspectives that are excellent resources for teachers.

Students need information about solutions for living in a world that is 1.5oC warmer and likely closer to 2.0oC. Solutions are more than wind turbines, solar panels, and electric vehicles. The psychology of human behavior, the importance of civic engagement, preparation for a sudden crisis, the economic potential of incentives, awareness of the role of the media, and an understanding of the actions of citizens are essential understandings for students.

“The wealthiest 10 percent of people globally produce around half of all greenhouse gas emissions, as well as having more to do to achieve a sustainable way of life,….” (page 330) The graph below clearly explains why climate education for students in the United States should be a curriculum mandate. The graph also illustrates the problems of inequality and injustice as a result of the economic system that currently dominates our world. An understanding of the big picture from 19th century colonialism and imperialism to the global supply chains of the 21st century are essential for understanding the invisible atmospheric changes that have been taking place for 150 years. The existential crisis that threatens to disrupt the comfortable lives of the students we are teaching will take place in the next few years or decades. This is the “inconvenient truth!”

As social studies educators we are responsible for teaching the lessons of the past, especially as they relate to the rise and fall of civilizations. The discovery of fire, writing, cement, crop rotation, the three-part plow, animal, water, and steam power, fossil fuels, electricity, nuclear energy, the automobile, department stores, credit cards, e-commerce, and artificial intelligence are curriculum topics that need to be carefully reviewed in how we are teaching them because they cumulatively contribute to a warmer planet. The graph below illustrates why this is a critical curriculum topic for social studies educators.
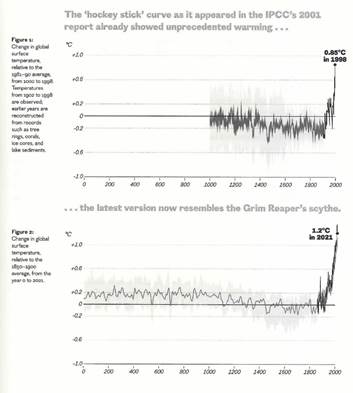
The great migrations in history are the result of wars, trade, investments, escape from authoritarian rulers, genocide, poverty, and extreme weather events. We teach about the migrations from the Irish famine, religious wars in Europe, African Slave Trade, European migration to the United States, Harlem Renaissance, Dust Bowl, Partition of India, Resettlement after World War II, and the urbanization of China. If history is a guide, the largest migration will occur in the 21st century because of the impact of extreme weather on agriculture, potable water, heat-related deaths, and higher sea levels.

The Climate Book is essential reading for teachers. The section on solutions (Chapter 5) provides critical information for debate and discussion with your students.

Using Graph Analysis to Document Climate Change

Social Studies teachers are expected to help students develop reading and analytical skills and promote written, oral, and numeric literacy. Including graphs like these in a lesson on the impact of climate change addresses both analytical skills and numeric literacy.

Source: https://www.climate.gov/news-features/understanding-climate/climate-change-global-temperature

A graph showing the temperature of the sun

AI-generated content may be incorrect.

This graph shows changes in Earth’s global average surface temperature using temperature anomalies in °C. A temperature anomaly is how much the temperature is above or below a reference “normal” period (1850-1900), rather than the actual temperature. Temperatures stay fairly stable in the late 19th and early 20th centuries, then rise noticeably from the mid-1900s, with the fastest warming in recent decades. This trend reflects the rise in greenhouse gases from human activities, especially burning fossil fuels, which trap heat in the atmosphere.

1. What does the horizontal x-axis represent?

2. What does the vertical y-axis represent?

3. At what point on this graph did global average temperature start to change?

4. What is the direction of this change?

5. What is the cause of this change?

Source: https://www.climate.gov/news-features/understanding-climate/climate-change-global-sea-level

A graph of a sea level

AI-generated content may be incorrect.

This graph shows changes in global average sea level from 1885 to 2025. Sea level is measured in centimeters compared to a long term baseline, so positive values mean higher than average seas. Over this period, sea level remained relatively low and stable in the late 19th and early 20th centuries, then began a steady rise in the mid‐1900s. The rise accelerates in recent decades due to warming temperatures, which cause ocean water to expand and ice on land to melt. This long‐term increase in sea level is consistent with global warming driven by rising greenhouse gas concentrations.

1. What does the horizontal x-axis represent?

2. What does the vertical y-axis represent?

3. When did sea levels begin to rise?

4. When did sea level rise accelerate?

5. What is the cause of this change?

Source: https://www.climate.gov/news-features/understanding-climate/climate-change-ocean-heat-content

A graph showing the growth of a company

AI-generated content may be incorrect.


This graph shows changes in the amount of heat stored in the world’s oceans from 1955 to 2024. Ocean heat content is measured in joules, which are units of energy; the same unit scientists use to compare energy in different parts of the climate system. When greenhouse gases trap heat in the atmosphere, more than 90% of that excess energy goes into the oceans instead of staying in the air. Because water can store large amounts of energy with only small temperature changes, increases in ocean heat content clearly show the long‐term warming of the climate system. The graph shows that ocean heat content has risen steadily, reflecting continued heat absorption by the oceans as the planet warms.

1. What does the horizontal x-axis represent?

2. What does the vertical y-axis represent?

3. When did ocean heat content start to change?

4. What is the direction of the change?

5. What is the cause of this change?

Source: https://ourworldindata.org/grapher/number-of-natural-disaster-events

A graph showing the number of storms reported

AI-generated content may be incorrect.

This graph shows the number of natural disaster events reported globally from 1955 to 2024. The data include disasters such as floods, storms, droughts, and wildfires that have been recorded in international disaster databases. The graph shows a clear upward trend in reported events over time. Some of this increase reflects better reporting and communication systems, especially in earlier decades.

1. What does the horizontal x-axis represent?

2. What does the vertical y-axis represent?

3. What is the trend in this graph?

4. What is the cause of this change?

Source: https://ourworldindata.org/co2-emissions

A graph showing the growth of the company's growth

AI-generated content may be incorrect.

This graph shows global carbon (CO2) emissions from 1885 to 2024, measured in gigatons of CO2 per year (GtCO2/yr). CO2 is the most abundant greenhouse gas emitted by human activities, mainly from burning fossil fuels such as coal, oil, and natural gas. The graph remains low and somewhat stable in the late 19th and early 20th centuries, then rises sharply throughout the 20th century as industrialization spread. Emissions accelerate particularly after World War II with increased reliance on fossil energy and continue to grow into the 21st century.

1. What does the horizontal x-axis represent?

2. What does the vertical y-axis represent?

3. When did carbon dioxide emissions start to change?

4. What is the direction of the change?

5. What is the cause of this change?

Source: https://ourworldindata.org/grapher/arctic-sea-ice

A graph of the arctic sea ice extent

AI-generated content may be incorrect.

This graph shows the annual maximum extent of Arctic sea ice from 1980 to 2024, measured in million square kilometers. Maximum sea ice extent refers to the largest area covered by sea ice each year, usually occurring in late winter. The graph illustrates a long term decline in the size of the Arctic’s winter ice cover, even though there is variability. This downward trend is linked to rising global temperatures, since warmer air and ocean conditions reduce the formation and persistence of sea ice.

1. What does the horizontal x-axis represent?

2. What does the vertical y-axis represent?

3. What is the trend with the annual maximum extent of Arctic sea ice?

4. What is the cause of this change?

Source: https://ourworldindata.org/grapher/global-methane-concentrations?time=earliest..20 25-09-15

A graph showing the amount of methane in the amount of gas

AI-generated content may be incorrect.

This graph shows changes in the concentration of methane (CH4) in Earth’s atmosphere from 1984 to 2024, measured in parts per billion (ppb). Methane is a powerful greenhouse gas (much more effective at trapping heat than CO2 over short time periods) and comes from both natural sources (wetlands) and human activities (agriculture, fossil fuel production). The graph reveals a steady rise in atmospheric methane over the time period, with especially notable increases in recent years. Rising methane contributes to enhanced greenhouse warming and amplifies climate change alongside carbon dioxide.

1. What does the horizontal x-axis represent?

2. What does the vertical y-axis represent?

3. When did the concentration of methane in the Earth’s atmosphere start to change?

4. What is the direction of the change?

5. What is the cause of this change?

Source: https://ourworldindata.org/grapher/ice-sheet-mass-balance

A graph showing the number of mass in the year

AI-generated content may be incorrect.

This graph shows the change in the mass balance of Antarctica’s ice sheets from 2002 to 2020, measured in gigatons per year (Gt/yr). Ice sheet mass balance represents the net gain or loss of ice (positive values mean ice is being added, and negative values mean ice is being lost.) The graph demonstrates that Antarctica has been losing ice overall during this period, with increasingly negative values over time. This ice loss contributes to global sea level rise because ice previously stored on land flows into the ocean. The moving toward more negative mass balance is consistent with warming ocean and air temperatures affecting ice stability.

1. What does the horizontal x-axis represent?

2. What does the vertical y-axis represent?

3. What is the trend in the mass balance of Antarctica’s ice sheets?

4. What is the cause of this change?

Personal Stories about the Impact of Climate Change

Changes in the global climate exacerbate climate hazards and amplify the risk of extreme weather disasters. Increases of air and water temperatures lead to rising sea levels, supercharged storms and higher wind speeds, more intense and prolonged droughts and wildfire seasons, heavier precipitation and flooding. The number of climate-related disasters has tripled in the last 30 years. The United Nations Environment Programme estimates that adapting to climate change and coping with damages will cost developing countries $140-300 billion per year by 2030.

Source: https://www.oxfam.org/en/5-natural-disasters-beg-climate-action#

An annual average of 21.5 million people were forcibly displaced each year by weather-related events – such as floods, storms, wildfires and droughts – between 2008 and 2016, according to the International Displacement Monitoring Centre. This figure reached a record 32.6 million in 2022. The International Environmental Partnership, an international thinktank, expects this number to surge. It predicts that 1.2 billion people could be displaced globally by 2050 due to climate change and natural disasters. Source: https://www.zurich.com/media/magazine/2022/there-could-be-1-2-billion-climate-refugees-by-2050-here-s-what-you-need-to-know

Source: Rethinking Schools

 “These are hard times for people like me who work on coffee farms. I’ve worked here in Sonsonate since I was a kid. I have done pretty much every job there is to do on this farm. There are a lot of problems now — pests, low prices for coffee beans — but the big one is climate change. It used to be that the rainy season would start in May. But with climate change, who knows? The rains sometime come early, and the coffee plants flower, but then the rain will stop and so things dry up. Sometimes the rains come late or don’t come at all. That leads to a terrible harvest. Forty years ago, this farm produced 4,000 tons of coffee. This year? It will produce about 300 tons. In the last 10 years in El Salvador, 80,000 people lost their jobs in the coffee industry. I guess I’m one of the lucky ones, because I still have a job, although it pays only about $30 a week. My daughter couldn’t find any work at all, other than trying to sell food on street corners. So in order to survive, she and her family joined one of the migrant caravans traveling to the United States. What else was she supposed to do? I’m old now, so cannot make the journey north, but if I was younger, I probably would. My friend, Reyna de Jesús López, who works on the coffee farm with me, paid to send her 12-year-old son to the United States. She says that sometimes he calls her to say that he wants to come home, but she tells him, “What are you going to do here? There are no opportunities for young people.” Things here have never been easy, but climate change made them worse. The government in the United States tells Salvadoran migrants to go home. But one of the main reasons migrants can’t go home is because of climate change — caused mostly by the rich countries, like the United States, with all their greenhouse gases.”

Source: Project Drawdown

I’m taking action on climate change solutions because I was made homeless three times by climate change, hurricanes hitting my island. So I feel it very personally. I am working on a project to restore the mangroves to a community called Water Key, which was a bone fishing destination. So we’re engaging with the community there, all of whom were also displaced by climate change. Hurricane Dorian in 2019. It is now 2024 and no one has been able to move back yet. They’re living on the main island of Grand Bahama. They go on the weekends to try to rebuild their homes. But we’re hoping now that when we plant thousands, hundreds of thousands of mangroves in and around that area that they will still be able to be a bone fishing destination and that those mangroves will grow. At the same time, the community will be able to move back to the island.

Source: Project Drawdown

“When I was growing up, we didn’t talk about climate change. We talked about global warming, the ice caps and polar bears. Everything changed for me when I moved to New Orleans, just a couple of days before hurricane Katrina hit. Hurricane Katrina was one of the deadliest hurricanes that made landfall in American history, killing over 1800 people. And it was also one of the most expensive disaster recovery efforts that we’ve had to undertake since then, things have only gotten worse. Our climate continues to get warmer and more unpredictable. We have stronger hurricanes, more wildfires, increased droughts and floods. The time to take action was really decades ago. The next best time to take action is now.”

Source: The Harvard Gazette

I’m a member of the Hoopa Valley Tribe in Northern California, and I live on the reservation, which is about an hour away from an actual Target or Costco, over two mountains. What’s special about the Hoopa tribe is that we’ve never stopped practicing our traditional ceremonies. I grew up in a culturally rich, matriarchal society. We have a woman’s coming-of-age ceremony to celebrate a woman’s coming into a leadership role in the community. We had a lot of women serving on the tribal council; my mom herself also served on the council. Our population is small: 2,000 people. And when I was younger, my family and other families used to rely a lot on natural resources. A lot of our food would come from the environment around us. But that slowly started to dwindle away as I got older because of climate change and the use of our waterways by big agricultural farms. Our water resources also decreased due to fires, and since our culture is so intertwined with our land and natural resources, it has become a lot harder to keep our culture. It is hard to make baskets or jewelry because natural resources are becoming scarce. For the younger generations, it has been hard to grow up without having access to those resources that can allow them to express themselves through culture and art. We see that playing out in a mental health crisis among students because of threats to their culture, which is being taken away.

Source: The Harvard Gazette

“I live on the north shore of Oahu, Hawaii, in a very small town called Kahuku. Our population is 2,000. We have one stoplight. We used to have a gas station; now it’s in the town over. Our sense of community identity is strong. As far as the impact of climate change in my community, I’ve seen the way beaches and landscapes have changed tremendously from when I was little to now. Native Hawaiians, and Indigenous folk everywhere, have a deep connection with the land and the water, and this is hard for other people to understand. For us, the land and water are living beings, sort of relatives that hold lots of stories that are so connected to our culture and identities. Hawaiian lives are deeply impacted by climate change and over-tourism, which is not sustainable and is also harmful to the environment. Indigenous people are forced to face the worst and most harmful impacts of climate change when we contribute the least to it.”

Source: The Harvard Gazette

“I grew up in Puerto Rico. In the past five years, we faced hurricanes, earthquakes, and COVID. There is no question that the worsening climate on our planet is making it more likely for natural disasters to occur, and I want to make clear the stark difference between the impact of climate change in the Global North and the Global South. What we underestimate, in the U.S. and the Global North, is how climate change worsens natural disasters. To us in the Global North, it means a couple more hurricanes, but for the Global South, where most developing countries are located, natural disasters are not ephemeral. They become significant; their gravity multiplies exponentially. Climate change is worse for the Global South because they are less able to recover from the increased volume and gravity of the impact of natural disasters. Puerto Rico was badly hit by Hurricane Maria five years ago, and people are still suffering to this day because of it. It is because of the catastrophic system failure that took place in the wake of Maria: All systems failed and became too weak to recover, and economically, it made it hard for the island to rebuild. Once the infrastructure is weakened, as well as its ability to recover, the island becomes more vulnerable to the next natural disaster. We just had Hurricane Fiona, which was a Category 1 hurricane, and we felt the damage as if it were Maria, which was Category 5.

Source: New York Times

“When the rain began to pour over Green Mountain, N.C., in late September, Alison Wisely kept a close eye on the puddles growing slowly outside her window. Hurricane Helene was churning across the American South, and Ms. Wisely, 42, and her fiancé, Knox Petrucci, 41, were hunkering at home with her two young sons. The house was hundreds of miles from any coastline. On the morning of Sept. 27, a nearby river overflowed, and catastrophe came quickly. Floodwaters rushed toward the couple and the children — Felix, 9, and Lucas, 7. In a frantic effort to escape, all four lost their lives. Their deaths represent only a small fraction of Helene’s terrible toll. The storm has killed more than 200 people, making it the deadliest tropical cyclone to strike the mainland United States since 2005.”

Source: Australian Climate Case

“My name is Emma. I’m sixteen years old and I live on the south coast of New South Wales. I’ve always been into nature and the environment. Growing up I used to get really upset when I saw a tree being cut down. Then we learned about climate change in year 7. I remember it being really scary – I thought the world was perfect but really it isn’t. I just thought the way we were living was fine but that was a real eye opener. Climate change is becoming part of our lives now and affecting us directly. I was here when the bushfires happened – it was New Year’s Eve and the smoke was coming from the south and the north. The smoke got thicker and thicker as the day went on. I remember looking at Gulaga and it was just glowing. Everyone was banding together in town and just waiting. Eventually we went home but we couldn’t do anything because the power was out. The next day when we woke up the sky was a dark red and the trees were black. It was surreal – I couldn’t tell what time it was. The wind kept changing direction – the Cobargo fires were coming towards us but we got lucky and the wind changed. Several times we evacuated to the golf course with all of our stuff until the threat had passed.”

Source: Australian Climate Case

“My clan is the crocodile clan – Saibai Koedal – on my father’s side and on my mother’s side I’m Fijian. My grandfather and his family left Saibai just after the war. He wouldn’t have called it climate migration, but a key reason for them leaving was that people’s gardens were starting to get inundated with salt water, making it harder to grow crops. He had the foresight to realize that if it got worse then Saibai wouldn’t be able to support us. People say ‘oh it was the 1940s’ but the Industrial Revolution was well underway and the climate was already changing. My family has been away from Saibai for more than 70 years. It’s definitely had an impact on how we use our language and practice our culture. The young boys in Seisia often say ‘one day I’ll get to go to the homeland’ even though we’re only a few islands away. We’re witnessing climate change happening here in Seisia now. We’re seeing more extreme weather and more intense storm surges. Elders say that it’s very different now to the old days. You can see the effects on the shape of the shoreline – the beach used to have a shallow gradient but storm surges and king tides have carved the sand into a steep slope.”

Source: Global Citizen

Lato K.Kenya: “As pastoralists in Kenya, we are experiencing long periods of drought and short but dangerous rain periods, which bring flooding. The drought causes starvation of our cattle and the rain drowns them.”

The Wildness Society has video interviews with five Americans whose lives were impacted by climate change. Source: https://www.wilderness.org/articles/blog/5-stories-people-impacted-climate-change-and-inspired-take-action

WaterAid has a feature on people impacted by climate change around Lake Chilwa in Malawi.      https://www.wateraid.org/uk/stories/climate-stories