President Richard Nixon – Price Controls and Ending the Gold Standard

Most decisions by American presidents and other world leaders do not have an immediate impact on the economy, regarding the macroeconomics of employment and inflation, at least in the short term of their administration. For example, President Franklin Roosevelt’s bank holiday, President John Kennedy’s tariff on imported steel, and President Ronald Reagan’s Economic Recovery Tax Act had limited immediate effects on the economy but their long-term effects are significant. The accomplishments or problems of the previous administration will likely impact the administration that follows. For example, President Biden faced criticism about the economy in his administration but the steps taken to address them may not show results until years later. The drop in Real Disposable Income from the administration of President Trump is significant because it measures income after taxes and inflation.

PresidentGDP GrowthUnemployment RateInflation RatePoverty RateReal Disposable Income
Johnson2.6%3.4%4.4%12.8%$17,181
Nixon2.0%5.5%10.9%12.0%$19,621
Ford2.8%7.5%5.2%11.9%$20,780
Carter4.6%7.4%11.8%13.0%$21,891
Reagan2.1%5.4%4.7%13.1%$27,080
H.W. Bush0.7%7.3%3.3%14.5%$27,990
Clinton0.3%4.2%3.7%11.3%$34,216
G.W. Bush-1.2%7.8%0.0%13.2%$37,814
Obama1.0%4.7%2.5%14.0%$42,914
Trump2.6%6.4%1.4%11.9%$48,286
Biden2.6%3.5%5.0%12.8%$46,682

This series provides a context of important decisions by America’s presidents that are connected to the expected economic decisions facing our current president’s administration. The background information and questions provide an opportunity for small and large group discussions, structured debate, and additional investigation and research. They may be used for current events, as a substitute lesson activity or integrated into a lesson.

In the case study below, have your students investigate the economic problem, different perspectives on the proposed solution, the short and long term impact of the decision, and how the decision affects Americans in the 21st century.

  1. The world’s economy collapsed as a result of World War I. The Bretton Woods Agreement provided stability with a fixed exchange rate of $35 U.S. dollars to an ounce of gold. The strength of the U.S. dollar and economy was good for the United States and other countries. In fact, the gold of most countries was at the Federal Reserve Bank in New York, so it was easy to physically move gold from one vault to another. The Marshall Plan provided $13.3 billion (about $175 billion in today’s money) to rebuild Europe. The Bretton Woods Agreement supported a global economy and international trade and cooperation.
  • By 1960, the U.S. economy began facing new challenges from the Baby Boomers, national debt, Cold War, trade deficit, higher unemployment and inflation. Economists introduced new research on the economy. The ideas of John Maynard Keynes that were seen as helpful to the challenges of the Great Depression and World War II were questioned in the 1960s by Milton Friedman and Paul Samuelson and other economists who carefully followed the money supply in the economy. In response to the cost of the Vietnam War and the Great Society programs, in addition to the increased consumption of the Baby Boomers, the interest rate policy of the Federal Reserve Bank supported an increase in dollars.
  • President Richard Nixon understood the political implications of the U.S. economy. Although an inflation rate of 4.7% may not appear to be a concern, it is an increase of 50% from the expected rate of 3% and a GDP growth rate of 2%. When President Nixon became president ever nation wanted dollars. The amount of dollars in circulation increased to four times the amount of gold in reserves. As aa result the dollar was overvalued and very strong. This situation negatively impacted our balance of trade with other countries. In 1971, the United States reported its first trade deficit.
  • As the supply of dollars increased over the quantity of gold, the United States Treasury feared that countries might ask for their gold and the United States would not be able to meet their demands. As inflation increases, the purchasing power of the dollar decreases. A simple solution would be to devalue the dollar but since it was pegged to gold at $35 an ounce, this was not possible. The situation became critical in 1971when Britain requested selling $3 billion dollars it had from a trade surplus for gold. The United States only had about $10 billion in gold and if other countries asked for gold, there would be an international crisis.
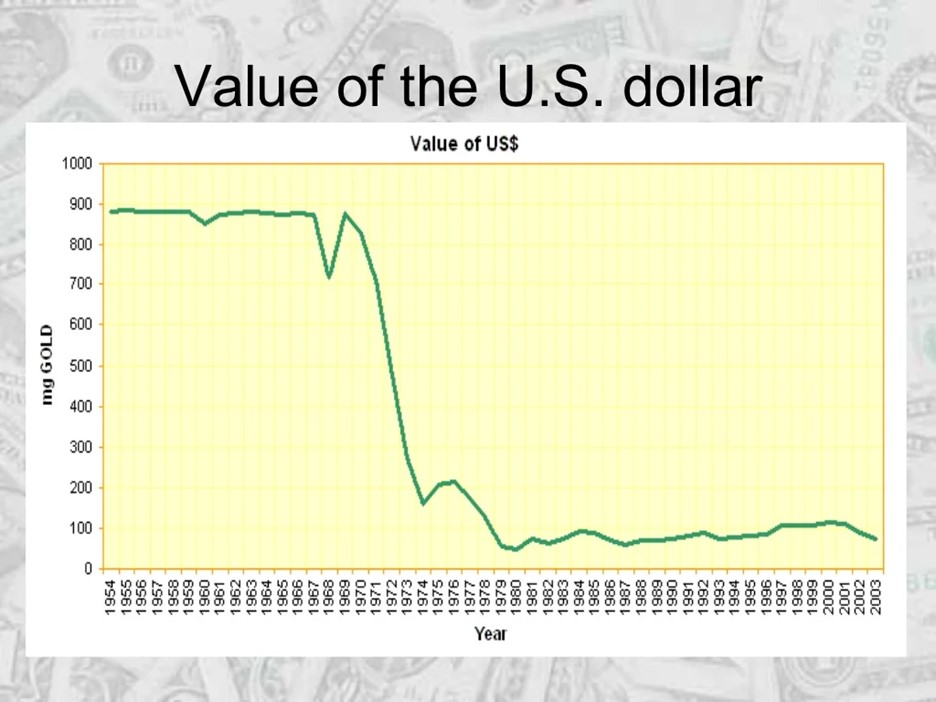
Examine the graph below for the years 1950-1970. Calculate the percent decline in the purchasing power of the dollar.  How does a weaker dollar affect trade and the national economy?  What are the advantages and disadvantages of a stronger and weaker dollar?

Examine the data in this chart, especially for the years, 1960-1980. The amount of gold reserves (left axis) is constant but the value of the dollar changes. Which events in the 1960s likely affected the weakening of the U.S. dollar? Which decisions or events in the 1970’s contributed to the noticeable decline in the dollar. How does a weaker dollar affect the economy differently for consumers and investors?

President Lyndon Johnson responded to the ‘small’ (18%) decrease in the value of the dollar in 1968 with a temporary (one-year) surcharge of 10% on income tax payments. The purpose of the additional tax was to reduce or stabilize the 3.0 percent rate of inflation. Even with the surcharge, inflation increased to 4.7% within the year. On August 25, 1969, the federal funds rate was at 9.75%, the highest level since World War 2, about seven percent above the GDP growth rate, and will cause an economic recession. The economic advisors, including Arthur Burns, Chairman of the Federal Reserve Bank, informed Nixon that the traditional monetary and fiscal policy tools were not working, President Nixon extended the tax surcharge through 1970. With the presidential election in 1972, Nixon knew that he needed to control the rising rate of inflation and avoid causing a recession.

President Nixon called for a secret meeting at Camp David to address this problem. He knew that politically the need to make a bold decision, like FDR with the decision to close the banks in March 1933. He also wisely sought the perspectives of economists with different points of view.

On August 15, 1971, President Nixon addressed the nation from the Oval Office with his historic decision, Executive Order 11615:

  1. Wage and price controls for 90 days
  2. Ending the Bretton Woods Agreement on converting dollars to gold
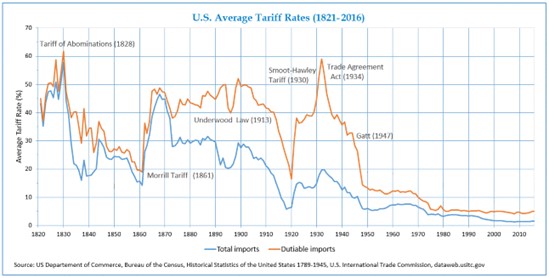
  3. 10% surcharge tax on tariffs

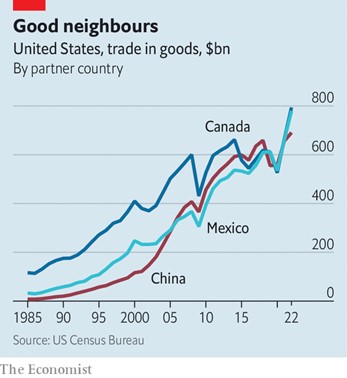
The Fed Funds rate in August 1971 was at 5.75% about three percent higher than the GDP rate of growth. One of the objectives of the “Nixon Shock” was to force other countries, especially China, to revalue their currencies to allow for a competitive free trade market for the United States. The stock market jumped 4% on August 16, but the decision to allow gold to be bought and sold at the market would lead to an unexpected increase in the price of oil. The wage and price controls and tariff surcharge were lifted by the end of 1971 but making the U.S. dollar the reserve currency of the world had lasting implications for the economy. President Nixon won the 1972 election by a landslide but the negative effects of then Nixon Shock would return in 1973.

Invite students to interview senior citizens who will have different perspectives as investors, bankers, union workers, homeowners, etc. on the “Nixon Shock.” For example, I was a high school teacher in New York City earning $5,500 a year. Prices were high from inflation and I was looking forward to a 20% salary increase, about $1,000, on September 1, 1971. My 1969-70 salary was frozen as was the pay scale for another year.  In 1973, the price of gasoline increased from 39 cents a gallon to more than 60 cents and gas was rationed. Although the energy crisis was the result of an embargo by OPEC against the United States for our support of Israel in the Yom Kippur War. After the embargo was lifted the higher cost of energy continued contributing to unemployment and continuing inflation. This became known as stagflation.

History of the Gold Standard

Gather information about the new technologies of how credit cards, money markets, and currency swaps increased personal spending, consumption, and the velocity of money.

  1. How did the banking industry change to ‘create’ new money in the economy?

In the chart below, currency represents coins and dollars, what we call cash.

M1 money represents currency plus money in a checking account which can quickly be exchanged for cash.

M2 money represents money that requires going to the bank tor waiting more than one month to convert the money to cash. (i.e. certificate of deposit)

  • Calculate the slope of the graph in dollars and also by the annual percentage change.
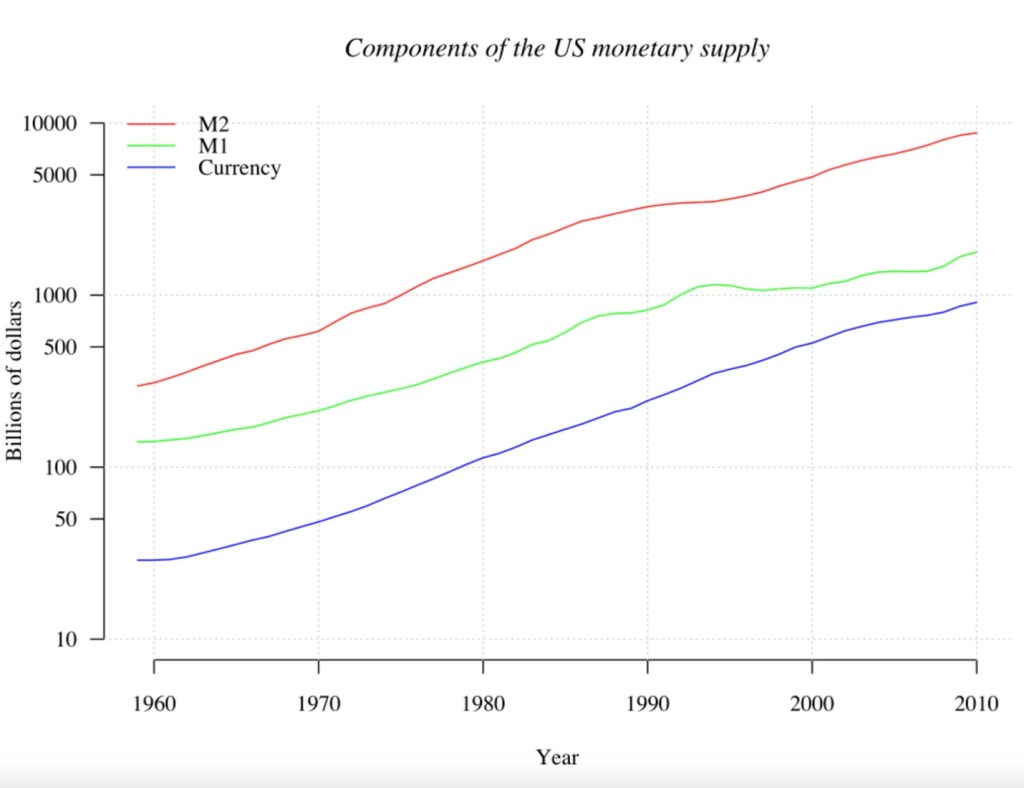
  • How did this contribute to inequality, consumer debt, and inflation?
  • What is the difference between installment credit and revolving credit?
  • How did the credit card change our standard of living?
  • What were the consequences of higher unemployment and full employment?
  • How did two income households affect the supply of money?

The Evolution of Consumer Credit in America

  1. What information is provided in the graph?
  2. What are several reasons for an increase in productivity by workers?
  3. How can high school students become more productive in their social studies class? (i.e. better grades, complete additional assignments and projects)
  4. Should a worker be paid on the amount of work they produce or on the wage they agreed to when they were hired? Should a teacher be paid based on the output (grades) of the students in their classes?
  5. Why do the red and blue lines diverge after 1970? Why is there a significant gap between what workers are producing in one hour and what they are paid?

The immediate impact of separating the value of the dollar from a fixed exchange rate of $35 was that the new value increased by 10% to $38 an ounce. It took about four years for the global economy to stabilize and accept dollars as the reserve currency (or safety net) in the event of a crisis. The supply of gold increased significantly after 1971 with about half of the current supply of gold being mined since the ‘Nixon Shock’.

  1. How do countries buy dollars? How does this affect our economy?

Source:

  • Is it possible for foreign countries to have too many U.S. dollars?
  • How would the decision of other countries to adopt a different currency affect the economy of the United States?
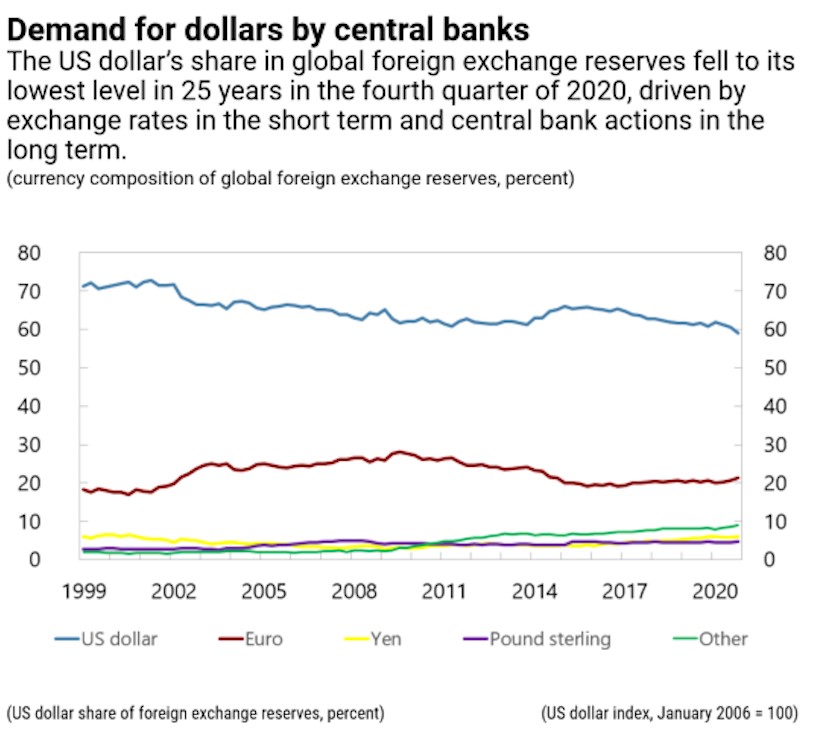
  • If a group of countries made a secret agreement to sell their U.S. dollars in a short period of time and purchase euros or the renminbi instead, how would the United States economy be affected?
  • What is the future of the dollar as the reserve currency? Does the United States have more advantages than disadvantages of being the dominant economic power in the world? The Dollar: The World’s Reserve Currency

President Bill Clinton – Tariffs and Free Trade Agreements

Most decisions by American presidents and other world leaders do not have an immediate impact on the economy, regarding the macroeconomics of employment and inflation, at least in the short term of their administration. For example, President Franklin Roosevelt’s bank holiday, President John Kennedy’s tariff on imported steel, and President Ronald Reagan’s Economic Recovery Tax Act had limited immediate effects on the economy, but their long-term effects are significant. The accomplishments or problems of the previous administration will likely impact the administration that follows. For example, President Biden faced criticism about the economy in his administration, but the steps taken to address them may not show results until years later. The drop in Real Disposable Income from the administration of President Trump is significant because it measures income after taxes and inflation.

PresidentGDP GrowthUnemployment RateInflation RatePoverty RateReal Disposable Income
Johnson2.6%3.4%4.4%12.8%$17,181
Nixon2.0%5.5%10.9%12.0%$19,621
Ford2.8%7.5%5.2%11.9%$20,780
Carter4.6%7.4%11.8%13.0%$21,891
Reagan2.1%5.4%4.7%13.1%$27,080
H.W. Bush0.7%7.3%3.3%14.5%$27,990
Clinton0.3%4.2%3.7%11.3%$34,216
G.W. Bush-1.2%7.8%0.0%13.2%$37,814
Obama1.0%4.7%2.5%14.0%$42,914
Trump2.6%6.4%1.4%11.9%$48,286
Biden2.6%3.5%5.0%12.8%$46,682

This series provides a context of important decisions by America’s presidents that are connected to the expected economic decisions facing our current president’s administration. The background information and questions provide an opportunity for small and large group discussions, structured debate, and additional investigation and research. They may be used for current events, as a substitute lesson activity or integrated into a lesson.

In the case study below, have your students investigate the economic problem, different perspectives on the proposed solution, the short- and long-term impact of the decision, and how the decision affects Americans in the 21st century.

Students in your class are likely familiar with mercantilism and its benefits to the “mother country” or “home country”. 18th century mercantilism utilized the resources and cheaper labor of colonies or other places to the benefit of one country. Adam Smith challenged the benefits of mercantilism and advocated laissez-faire economics, the balance of supply and demand, and open markets. Smith believed that mercantilism was a self-defeating system that limited economic growth and national wealth. He argued that a free-market system and free trade would produce true national wealth. 

However, political leaders may not agree (or understand) economic theories or how economic systems work. In Washington’s administration, Secretary of the treasury, Alexander Hamilton argued for a tariff. His Report on Manufacturers argued for the protection of the new manufacturing sector of the United States (Paterson and the Great Falls) and having a tariff to raise revenue for the federal government. Hamilton compromised on his tariff plan and the Tariff Act of 1789 was only 5%.

Henry Clay’s American System supported tariffs to protect our economic growth from foreign imports. His speech in 1824 was the first attempt to make America self-sufficient and independent of other countries. In 1828, Congress passed the Tariff of Abominations which led South Carolina to pass the Nullification Act.  The Tariff of 1828 set a 38% tax on some imported goods and a 45% tax on certain imported raw materials.

  1. How was the American System designed to work?
  2. What impact did the American System have on the U.S. economy during the early to mid-1800s?
  3. Did the American System benefit each region equally or did some regions have an advantage?
  4. How did the American System set the stage for the Industrial Revolution and sectionalism?
  5. What lessons should have been learned from the Tariff of 1828?

In the chart below, use the data beginning in 1800 with the Per Capita Income (per person) set at 200. This number indicates that the per person income from 1700 to 1800 doubled. Next, examine the indicator in 1850, which is set at 220. This indicates that the per person income increased only 20% in the fifty years since 1800. This is less than one-half percent per year on average.

Next, compare the date on tariff rates in the graph above with the per capita income rates in the graph below. Do tariffs impact economic growth?

At the beginning of the 19th century, the United States was a rural and agricultural country. Our nation’s population was small compared to Britain and France and scattered over a large area. Our population was 5.3 million in 1800, compared to Britain’s 15 million and France’s 27 million. Tariffs from Britain and France were high and significantly made the price of imported goods in the United states high.

After the War of 1812, the American economy began to grow. The development of steamboats, canals, railroads and the telegraph reduced costs and made communications faster. The growth of cities created markets for industrial goods. New inventions increased agricultural production and textile manufactures.  Children, immigrants, and women provided affordable labor.  Source

Discuss and debate the role of the federal government in the economy.

Do tariffs support or restrict economic growth?

Does free trade support or restrict economic growth?

Why do you think Britain lowered tariffs after 1828 and France did not?

Is economic growth dependent on the age, health, and skills of the labor force?

Is economic growth dependent on the infrastructure of a country to facilitate the distribution of goods and services?

How can governments best distribute wealth equally in the economy?

Do national leaders have any significant influence on economic growth?

How did the stock and commodities markets provide money (capital) for economic growth?

After the Civil War, the United States experienced unprecedented economic growth with the Industrial Revolution, imperialism, and immigration. The use of greenbacks and silver provided capital, cities provided markets for stores, immigrants provided affordable labor, and new technologies increased productivity and the efficient distribution of goods and services.

The beginning of a market exchange for bonds, agricultural products, and stocks developed with the Buttonwood Agreement in Manhattan. Stockbrokers and merchants met under the Buttonwood tree to sign an agreement that established the foundation for the New York Stock Exchange. The building with the flag is the Tontine Coffee House, where stocks were eventually traded.

The Mohawk & Hudson Railroad Company was the first railroad stock listed on the NYSE in 1830. At that time, the Exchange was called the New York Stock & Exchange Board. Banks and steel foundries were also listed. Mercantile exchanges for agricultural products provided guidance on the future demand for wheat, rice, tobacco, cotton and other products. These investments supported economic growth more than the protectionism of tariffs.

The flow of international capital into the United States provided capital for the Industrial Revolution that followed the Civil War. The market cap/GDP ratio tripled from around 15% in the 1860s to 50% by 1900. The inflation in the United States that occurred after World War I, World War II and the Vietnam War reduced the relationship of the market cap/GDP ratio and slowed the rate of economic growth. After each of these inflationary cycles, a return to higher tariffs to limit cheaper imports from other countries was the solution proposed by political leaders.  Economists, Joseph Schumpeter, Friedrich Hayek, John Maynard Keynes and Milton Friedman advocated for lower tariffs, innovation, and entrepreneurs to promote economic growth. The ratification of the 16th amendment and the adoption of the income tax in the United States undermined the argument that tariffs were necessary to fund the government and to protect industries from foreign competition.

President Hoover signed the Smoot-Hawley Tariff Act in 1930 raising the tariff by an average of 20% to protect American farmers from the effects of the stock market crash. The tariff caused trade between Europe and the U.S. to decline by two-thirds. At the end of World War II, tariffs were decreased substantially, and the U.S. supported the establishment of the World Trade Organization, which has sought to promote the reduction of tariff barriers to world trade.

  1. Does the public or private sector have the greater influence on economic growth and stabilizing inflation?
  2. What can be done to limit the effects of business cycles leading to inflation and unemployment?
  3. How effective are tariffs, embargoes, and sanctions in getting leaders of countries to negotiate or change their policies to align with the interests of the United States?
  4. Under what circumstances might tariffs be justified or effective?
  5. Examine the graph below to determine the biggest employer in the United States.
  • What conclusions can you make about the largest private employers in each state from the map below?

RWJBarnabas Health is the largest private employer in New Jersey, with 31,683 employees. Healthcare is a major employer in the state, accounting for 16% of all jobs. Who is the largest private employer in your county?

Use the chart below to compare the change in prices for an automobile before and after a hypothetical tariff of 20%. Because automobiles have thousands of parts and assembling an automobile often occurs in different countries, a tariff has the greatest impact on new cars.

Interview a local car dealer in your community about how a tariff will affect their business and how they plan to respond with sales, rebates, reduced financing, layoffs of workers, etc. Also ask about how a tariff will affect parts, tires, and the repair or maintenance of automobiles.

Make a list of five or more other businesses in your community that import supplies from other countries. (phones, Dollar Stores, coffee, clothing, TV monitors, etc.) If possible, research or interview the manager of a local big box store (Walgreens, Target) about how a tariff will affect their business.

Create a graphic design or flow chart to illustrate how the effect of higher prices from tariffs will affect consumer spending. For example, if prices increase by 20% and salaries increase by 5%, how will this affect businesses and households? Higher prices from tariffs are considered inflationary and layoffs from reduced sales are considered recessionary. Discuss what the short-term impact (three years) will be on the economy and your family.

In 1951, six countries (France, Germany, Italy, Belgium, Netherlands, and Luxembourg) agreed to sell coal and steel to each other without tariffs. The European Coal and Steel Community (ECSC) established a single common market. In 1957, the European Economic Community (ECC) was created by the Treaty of Rome. The six countries that formed the European Coal and Steel Community agreed to trade additional goods without tariffs, to work together on nuclear power plants for energy, and to form a parliament. In 1992 the Maastricht Treaty was signed by 12 countries leading to the European Union and a common currency, the euro, in 1999. The euro was fully implemented by 2002.

President Clinton’s administration signed the North American Free Trade agreement with Mexico and Canada in 1993 (it became effective on January 1, 1994) removing tariffs between these countries. The Transatlantic Trade and Investment Partnership (T-TIP) is a trade and investment agreement currently being negotiated between the United States and the European Union. This agreement will allow American families, workers, businesses, farmers and ranchers through increased access to European markets for Made-in-America goods and services.

In 2020, the Conservative Party in Britain convinced the people to leave the European Union (Brexit).  The United Kingdom was the second-largest economy in Europe, its third-most populous country, and one of the largest contributors to the budget of the European union.  In January 2024, an independent report by Cambridge Econometrics claimed there were two million fewer jobs, and the prices of essential goods were higher. As a result of Brexit, the average citizen (per person) lost about 2,000 pounds and someone living in London about 3,400 pounds as a result of leaving the common market.

It is difficult to assess the impact of NAFTA on the United States because of currency value fluctuations, trade with China, the impact of technology, the relocation of some corporations, and the values placed on agricultural products.  The Center for Economic and Policy Research estimated in 2014 a decline from a surplus of $1.7 billion to a deficit of $54 billion. The data in the graphs below suggest a positive trade balance with Canada and Mexico over the past 30 years. (1994-2022) Mexico, Canada, and China are the three major trading partners with the United States.

In the graph below there is a slight increase in exports from the United States to Mexico and exports with Canada continue at 15%. Exports to China had a significant drop of about one-third.

Data Reflecting the new USMCA ratified in 2019.

Maple syrup, pine lumber, and cranberries are a few items in our homes that are likely imported from Canada under NAFTA or the new USMCA. Lululemon and Blackberry are brands from Canada. Appliances, automobiles, tomatoes, avocados, electronics, monitors are some items from Mexico.

Identify items in your home with labels from Mexico and Canada, interview merchants in supermarkets and department stores, and conduct research to identify the importance of trade between the United States, Canada, and Mexico.

Develop a position statement or a short paper explaining your opinion on tariffs and free trade agreements to stimulate economic growth and stabilize inflation.