Book Review: Civic Capitalism, by Colin Hay and Anthony Payne (Polity Press, 2015)

Hay and Payne have assembled in this brief book 11 readings about capitalism and the realities of looking at modern economies through the lens of capitalism.  The book is a result of a blog created and refreshed on the topic of the global crisis of the last few years. 

Hay and Payne discuss and assemble readings here related to what they call “civic capitalism.”  This is the “governance of the market, by the state, in the name of the people, to deliver collective public goods, equity, and social justice” (p. 3).  They explain that this term has as its core the requirement that citizens must now “…ask what we can do for us and not what capitalism can do for us” (p. 4).  Citizens must turn around the notion that they serve capitalism and must respond to its rules

This, in a nutshell, describes what the spirit of this book is and what the readings cover.  The book deals further with the implications for all economies since commerce among nations is so complex now.

The book has to do with getting right what was done wrong.  The book contains a variety of readings current on the disastrous complications of the recent recession and away from a traditional growth model and toward one that takes into account more cultural differences worldwide, the context in which growth (or on-growth happens) and the social side of capitalism. 

Without giving away too much content in this review, I will say that there is very interesting information to read about here related to the workings of civic capitalism, and one does not need to be an expert in Economics to understand the explanations and recommendations coming from these savvy people.  This is a readable and essential book for educators to grab onto.  We must understand much more about the world economic situation if we are to be able to help struggling families, sway political thought, make changes in society, influence others, and convince elected officials how to vote. 

These are all activities in which educators must be involved.  I maintain that we  must be involved in them at least to some extent.  Teachers, administrators, and others who teach other persons at whatever level need to have a good sense of how we got to where we are financially and some ideas on how to move ahead. 

Although the contributors are a little idealistic at some points (can one person really change the international flow of dollars for investment?  Really?) they nonetheless do explain a great deal of information that is essential for understanding the benefits, drawbacks, workings, and potential of capitalism.

It is up to the educator to read this assembly of authentic texts and see how to incorporate them in their own worldview, use them in their plans to influence others, write lesson plans for more advanced level high school courses, make use of them in courses for college students, and take from the readings information good for use in debates and negotiations with other professionals interested in discussing and working on the work world economy.  At least in some smaller fashion.

I recommend the book and especially the introductory chapter on “civic capitalism” because of the clarity and the definitions found there.  Hay and Payne are able to explain a great deal of technical information in that chapter so that the reader will be comfortable diving into the discussions of big changes.  Those big changes—mainly in perspective—make up the rest of the readings in the book.      

Civics Era 10 – The Great Depression and the New Deal (1929-1945)

www.njcss.org

The relationship between the individual and the state is present in every country, society, and civilization. Relevant questions about individual liberty, civic engagement, government authority, equality and justice, and protection are important for every demographic group in the population.  In your teaching of World History, consider the examples and questions provided below that should be familiar to students in the history of the United States with application to the experiences of others around the world.

These civic activities are designed to present civics in a global context as civic education happens in every country.  The design is flexible regarding using one of the activities, allowing students to explore multiple activities in groups, and as a lesson for a substitute teacher. The lessons are free, although a donation to the New Jersey Council for the Social Studies is greatly appreciated. www.njcss.org

The beginning of the 20th century marks the foundation of the transformation of the United States into a world power by the middle of the century. In this era economic prosperity and depression, the ability of our government to provide for the needs of people experiencing economic hardship, and the rise of dictators attacking innocent civilians and threatening the existence of democratic governments leading to a second world war dominate the narrative of this historical period. The development of the new technologies of electricity, transportation, and communication challenged our long-held traditional policies of limited government, neutrality, and laissez-faire capitalism.

In the 1930s, Father Charles Coughlin, a Roman Catholic priest, had a weekly radio program with millions of listeners in the United States. In 1926 he broadcast weekly sermons but as the economy shifted into a recession and depression, his broadcast became more political and economic. They also reflected anti-Semitism with verbal attacks on prominent Jewish citizens. His broadcast following Kristallnacht on November 10, 1938 was particularly divisive. The owner of WMCA, a New York station, refused to broadcast Father Coughlin’s messages

The owner of WMCA, the New York station that carried his program, refused to broadcast Coughlin’s next radio message. The Nazi press reacted to the news with fury: “America is Not Allowed to Hear the Truth” declared one headline. “Jewish organizations camouflaged as American…have conducted such a campaign…that the radio station company has proceeded to muzzle the well-loved Father Coughlin.” A “New York Times” correspondent in Germany noted that Coughlin had become for the moment “the hero of Nazi Germany.” 

In the United States the Federal Communications Act of 1934 and subsequent additions regarding television and quiz shows mostly protects licenses, ensures equal access to all geographic areas, and provides for a rapid communications system regarding emergencies and national defense. It protects First Amendment rights regarding content, with some restrictions regarding profanity or inappropriate sexual content or images. The absence of specific content regulations allowed Orson Welles in 1938 to produce “War of the Worlds” over the radio leading to a panic by many citizens regarding their fear of an alien invasion.  The Fairness Doctrine of 1949 requires broadcasters to allow responses to personal attacks and controversial opinions. In 1969, the U.S. Supreme Court’s decision in Red Lion Broadcasting Co., Inc. v. Federal Communications Commission challenged the constitutionality of the Fairness Doctrine allowing the popularity of political radio and television talk and news programs.

Federal Communications Act of 1934

Broadcast Media Policy in the United Kingdom

The use of public media in the United Kingdom has specific statues to balance the perspectives of opinions and to prevent or limit the public broadcast media as a platform to present the views of the government, propaganda, or to advocate for a particular point of view on a controversial issue. The diversity of opinion in the United Kingdom for the BBC must respect opinions reflecting urban and rural populations, age, income, geography, culture, and political affiliations. There are also reasonable guidelines regarding the editor’s judgment to exclude a particular perspective. Facts and opinions must be defined and clearly stated.   Section 4 Impartiality: 4.3.14     BBC Editorial Policy

In the United States, deposits in most banks are protected up to $250,000 for each investor. This protection restored confidence in American banks during the Great Depression and is an important reason for a sound financial system in the United States. Investments in stocks and bonds fluctuate with market conditions.  Every bank in the United States also has deposits that are not insured. Investments in stocks, mutual funds, and corporate bonds are not insured by the Federal Deposit Insurance Corporation.

The Federal Reserve Bank establishes a reserve requirement, currently 10%, for banks to maintain to ensure adequate funds for withdrawals. The Federal Reserve Bank also monitors the member banks in the Federal Reserve System. Banks are assessed on all of their deposits quarterly and a formula is used to calculate their insurance payment. The FDIC is self-insured, although backed by Congress in the event of a catastrophic collapse of the banking system.

In Japan, the Deposit Insurance Act was enacted in 1971. The DIA fully insures deposits that do not earn interest.  In the United States amounts in checking, savings, money market accounts, and Certificates of Deposit are insured. Deposits that earn interest in Japan are insured up to 10 million yen, or about $70,000.

The most recent crisis in Japan is the exposure of the Aozora Bank to bad loans and investments in the United States. In 2024, it posted a net loss of 28 billion Japanese yen or about $191 million in U.S. dollars. A major earthquake in Japan, effects from extreme weather, or a military conflict would likely present major risks to Japan’s banks.

Examples of countries without any defined deposit insurance are China, Egypt, Israel, Pakistan, and South Africa. Perhaps one-third of the countries in the world do not protect deposits in their banks.

Failed Banks in the U.S. by Year (Forbes)

Federal Deposit Insurance Corporation

Video: FDIC (13 minutes)

Japan’s Banking Crisis in the 1990s (Video)

Huey P. Long is a challenging person for historians and educators. His ‘Share the Wealth’ program, use of the media, authoritarian actions, and criticisms of voter manipulation provide for diverse perspectives. However, he improved healthcare in Louisiana by expanding the Charity Hospital System, creating the Louisiana State University Medical School, reforming institutions to care for the disabled and mentally challenged, and providing free health clinics and immunizations. As a result, many lives were saved.

As governor, Long tripled funding for public healthcare. The state’s free health clinics grew from 10 in 1926 to 31 in 1933, providing free immunizations to 67 percent of the rural population. By building bridges and paving new roads, he made it possible for the rural poor to have access to medical and dental health care and hospitals. In the long historical timeline toward universal health care insurance in the United States, Huey P. Long is a pioneer.

Before Huey Long’s reforms, patients at the Central Hospital for the Insane were locked in chairs during their ‘recreation’ time.  from Every Man a King by Huey Long; reproduced by permission.

Long by-passed the negative press by distributing his own newspaper, “The American Progress,” and he spoke directly to a national audience through radio speeches and speaking engagements. In a national radio broadcast on February 23, 1934, Huey Long unveiled his “Share Our Wealth” plan a program designed to provide a decent standard of living to all Americans by spreading the nation’s wealth among the people. Long proposed capping personal fortunes at $50 million each (roughly $600 million in today’s dollars) through a restructured, progressive federal tax code and sharing the resulting revenue with the public through government benefits and public works. In addition, he advocated for a 30 hour work week, four weeks of paid vacation for every worker, free college or vocational educational and limiting annual incomes to $1 million or about $60 million in today’s dollars. He also advocated for pensions and health care provided by businesses and the government.

Long believed that it was morally wrong for the government to allow millions of Americans to suffer in poverty when there existed a surplus of food, clothing, and shelter. By 1934, nearly half of all American families lived in poverty, earning less than $1,250 annually.  He supported a health care system for all people using government funds.  Long’s authoritarian use of power helped him achieve his goals until his assassination in 1935.

There are four basic health care models

The United States has one of the most expensive health care systems in the world. It invests in research,

However, in 2021, 8.6 percent of the U.S. population was uninsured.  The U.S. is the only country where a substantial portion of the population lacks any form of health insurance. The U.S. has the lowest life expectancy at birth, the highest death rates for avoidable or treatable conditions, the highest maternal and infant mortality, and one of the highest suicide rates in the world. It also has the highest rate of people with multiple chronic conditions and an obesity rate nearly twice the average of other developed countries.

The current programs provided by Medicare (for people over age 65), Medicaid (for people with low incomes), and the Affordable Care Act (current program for most people) are each under attack because of the high costs associated with them and government regulation of the prices paid.

In your research and discussion consider the following models of health insurance and the programs Gov. Huey P. Long implemented in Louisiana in the 1930s.

The Beveridge Model

This model is named after William Beveridge, the social reformer who designed Britain’s National Health Service. In this system, health care is provided and financed by the government through tax payments, just like the police force or the public library.

Many, but not all, hospitals and clinics are owned by the government; some doctors are government employees, but there are also private doctors who collect their fees from the government. This system has the lowest costs per person, because the government controls what doctors can do and what they can charge. Great Britain, Spain, most Scandinavian countries, New Zealand, and Cuba are countries using this model or one that is similar.

The Bismarck Model

The Bismarck models uses an insurance system financed jointly by employers and employees through payroll deduction. Every person is covered. Doctors and hospitals are private operators. Although there are many payers to this model, costs tend to be regulated by the government. Germany, France, Belgium, the Netherlands, Japan, Switzerland, and some Latin American are countries that use this model.

The National Health Insurance Model

This system has elements of both Beveridge and Bismarck models. It uses private-sector providers, but payment comes from a government-run insurance program that every citizen pays into. Costs are considered low because there are no profits, no advertising, and claims are pre-approved. It is a single payer system and as a monopolist it is in a position to negotiate for the lowest prices. This system also has the ability to limit the medical services it will pay for, such as preventive care or what is considered elective procedures. Canada, Taiwan, and South Korea are countries using this model. For Americans over the age of 65, Medicare is similar to this model.

Health insurance is mostly a benefit for industrialized countries. Of the 195 countries on planet Earth, about 40 or 25% have established health care systems. In countries using this model, the poor are neglected.  This is a problem for hundreds of millions of people who have low incomes or are living below the poverty line.

In 2023, the offi­cial pover­ty thresh­old in the United States was $30,900 for a fam­i­ly of two adults and two chil­dren. Fam­i­lies can earn well over this amount and still find they cannot pay all of their bills.

Poverty is relative.  Someone in your class, school, community, etc. will be in the bottom 25% of income earners. An individual earning an hourly wage of $20.00 an hour who works for 35 hours a week earns $700 a week or $36,400 a year. This total is reduced by state and federal taxes and a 7.65% tax on Medicare and Social Security. Although $20 an hour is higher than the minimum wage in every state, it is not considered a living wage.

About one in sev­en (14%) of children under age 16 are in pover­ty in the United States.  This means that about 10 mil­lion kids in 2023 were liv­ing in house­holds that did not have enough resources for basic needs such as food, hous­ing and utilities.  The poverty rate in New Jersey is 10% of the population or about 950,000.  See the SPM child pover­ty rate in your state   The high­est rates of pover­ty gen­er­al­ly occur for the youngest chil­dren — under age 5 — kids in sin­gle-moth­er fam­i­lies, chil­dren of col­or and kids in immi­grant families. The numbers of children and adults living in poverty are increasing and they are a serious problem. The effects of living in poverty are the concern of your discussion as is the most effective way to reduce or eliminate it.

The effects of eco­nom­ic hard­ship dis­rupt the cog­ni­tive devel­op­ment, phys­i­cal and men­tal health, edu­ca­tion­al suc­cess of children. Researchers esti­mate the total U.S. cost of child pover­ty ranges from $500 bil­lion to $1 tril­lion per year based on lost pro­duc­tiv­i­ty and increased health care expenses.

In the United Kingdom, the poverty rate for children is 31% or double the rate in the United States. There is no single, universally accepted definition of poverty for the world.  The United States identifies an income level for family categories and the United Kingdom uses a measure of disposable income (after taxes) below 60% of the median income (income of the largest group in the population) on an annual basis.

For example, the median income in the United States is $40,000. If we used this formula, the poverty level would be $24,000 (after taxes). If we consider a 20% federal tax, 8% FICA and Medicare tax, and a 5% state tax for a person employed in New Jersey making $40,000, their disposable income would be approximately $27,000 or similar to the measure used in the United Kingdom.  If you consider the cost of rent at $2,000 a month, transportation costs at $200 a month, and food at $500 a month for a family or individual in New Jersey, these expenses are $2,700 a month or $32,400 a year. An income threshold of $30,000 a month is not practical.

Dr. Francis Townsend, a medical doctor living in Long Beach, California, introduced a plan in 1933 to provide direct payments to people over the age of 60. The money would be raised through a national sales tax, which in some countries is labeled a Value Added Tax of VAT.

“It is estimated that the population of the age of 60 and above in the United States is somewhere between nine and twelve millions. I suggest that the national government retire all who reach that age on a monthly pension of $200 a month or more, on condition that they spend the money as they get it. This will ensure an even distribution throughout the nation of two or three billions of fresh money each month. Thereby assuring a healthy and brisk state of business, comparable to that we enjoyed during war times.

“Where is the money to come from? More taxes?” Certainly. We have nothing in this world we do not pay taxes to enjoy. But do not overlook the fact that we are already paying a large proportion of the amount required for these pensions in the form of life insurance policies, poor farms, aid societies, insane asylums and prisons. The inmates of the last two mentioned institutions would undoubtedly be greatly lessened when it once became assured that old age meant security from want and care. A sales tax sufficiently high to insure the pensions at a figure adequate to maintain the business of the country in a healthy condition would be the easiest tax in the world to collect, for all would realize that the tax was a provision for their own future, as well as the assurance of good business now.”

Dr. Townsend’s plan became popular with the people and became known as The Townsend Movement.  Although it was criticized by President Franklin Roosevelt, the Social Security Administration is similar to what Dr. Townsend proposed.  He published a newsletter, The Modern Crusader, to promote his plan. The Social Security plan is funded by a tax on incomes because the burden is shared proportionately by different income levels. 

Welfare, unemployment compensation, Medicaid, Medicare, and Social Security are payments to United States’ citizens that are currently being discussed and evaluated. The average monthly payment is slightly less than $2,000. These are direct payments to people from the government, which also benefit local communities as the money is spent on food, housing, and basic needs, and provides a safeguard against bankruptcy and financial hardship. They may also increase the federal debt of a country in times of high unemployment or a pandemic.

Policy makers and economists must also consider public policies regarding the poor and senior citizens. The discussion questions below address the question of poverty for the young, disabled, and elderly and how to finance them.

  1. Do governments have a responsibility to provide financial assistance or a guaranteed living wage to individuals or families with inadequate finances for basic needs?
  2. Are direct income payments a burden on a government or do they provide an efficient return on their investment over time?
  3. Is the question of how to reduce or prevent poverty a matter of taxation or a a matter relating to the priorities of the federal budget?
  4. When people with mortgages apply the cost of interest as a deduction on their income tax, should this be considered an income transfer policy of the government providing assistance to people who are able to own property or their own home?
  5. Should income transfers be made in cash or in-kind benefits such as food stamps, vouchers for health care, etc.?
  6. Should the government regulate the consumption expenses of people receiving income transfers?
  7. Should income transfers be financed by income taxes, consumption taxes, or another method?

https://www.ssa.gov/history/towns5.html (The Townsend Plan)

https://www.ssa.gov/history/towns8.html (Francis Townsend’s Autobiography)

https://socialwelfare.library.vcu.edu/eras/great-depression/townsend-dr-francis/ (Social Welfare History Project)

https://lordslibrary.parliament.uk/child-poverty-statistics-causes-and-the-uks-policy-response/#heading-2 (House of Lords Library)

President Ronald Reagan and the Economic Recovery Tax Act (Social Security)

Most decisions by American presidents and other world leaders do not have an immediate impact on the economy, especially regarding the macroeconomic issues of employment and inflation. For example, President Franklin Roosevelt’s bank holiday, President John Kennedy’s tariff on imported steel, and President Ronald Reagan’s Economic Recovery Tax Act had limited immediate effects on the economy, but their long-term effects were significant. The accomplishments or problems of a previous administration may impact on the administration that follows.

For example, President Biden faced criticism about the economy during his administration. The jobs created with the Bipartisan Infrastructure Law and the interest rate policy of the Federal Reserve Bank to lower inflation did not show results until years later. The drop in Real Disposable Income from the administration of President Trump is another example. Real Disposable Income is a measure of income that is adjusted for inflation. The drop between the administration of President Bident and Trump is the result of extended unemployment benefits, people working from home during the pandemic when businesses were closed, and stimulus checks from the government. The economic transition following the end of the pandemic had a significant impact on the economy.

PresidentGDP GrowthUnemployment RateInflation RatePoverty RateReal Disposable Income
Johnson2.6%3.4%4.4%12.8%$17,181
Nixon2.0%5.5%10.9%12.0%$19,621
Ford2.8%7.5%5.2%11.9%$20,780
Carter4.6%7.4%11.8%13.0%$21,891
Reagan2.1%5.4%4.7%13.1%$27,080
H.W. Bush0.7%7.3%3.3%14.5%$27,990
Clinton0.3%4.2%3.7%11.3%$34,216
G.W. Bush-1.2%7.8%0.0%13.2%$37,814
Obama1.0%4.7%2.5%14.0%$42,914
Trump2.6%6.4%1.4%11.9%$48,286
Biden2.6%3.5%5.0%12.8%$46,682

This series provides a context of important decisions by America’s presidents that are connected to the expected economic decisions facing our current president’s administration. The background information and questions provide an opportunity for small and large group discussions, structured debate, and additional investigation and research. They may be used for current events, as a substitute lesson activity or integrated into a lesson.

In the case study below, have your students investigate the economic problem, different perspectives on the proposed solution, the short- and long-term impact of the decision, and how the decision affects Americans in the 21st century.

President Roosevelt introduced Social Security as a transfer payment to workers who would retire at age 65 with a life expectancy of 70 years in 1940. The income of workers was taxed, and Social Security was generously funded by workers. Today, there are only two workers contributing to Social Security for every retiree receiving a monthly check. It is considered a transfer payment because the money received is spent locally on basic needs and part of the amount is taxed.

President Johnson expanded Social Security to include Medicare and Medicaid. President Reagan began taxing the benefits received, raised the retirement age to 67, and allowed for contributions from payrolls to Individual Retirement Accounts. President Trump raised the age from 70 ½ to 73 ½ regarding required minimum withdrawals from private retirement accounts.

Retirement is a relatively new concept in economic history. Social Security began in 1935, and American presidents have made significant changes to it, especially in the last 50 years. Defined pension plans were offered to employees in the first half of the 20th century but became too expensive for most corporations.  Today, many public service workers, teachers, police, fire) have defined pensions and receive a monthly distribution. Without monthly Social Security payments, it would be difficult for retired individuals to live above the poverty line.

The evolution of Individual Retirement Accounts began with President Gerald Ford in 1976, and presidents have made changes to it over the past 50 years. Most American workers have an IRA, which may be called a 401(k), 403(b), Roth or something else. Today there is $40 trillion invested in mutual funds and U.S. securities in IRA accounts of Americans. In this case study, you will analyze the economic importance of this money, which is about equal to the national debt of the United States government. Today, about 40% of American households have an IRA account. Most of the remaining 60% will depend on Social Security, personal savings and assets, or fall into poverty.

  1. How does having approximately 8% of your paycheck withheld for Social Security and Medicare affect the economy, stock market, and the quality of family life?
  2. How do other countries provide support for their retirees?  Is it valid to compare a large country (USA) with a smaller country with a higher ranking (Denmark)?     Source
  3. If you were an economic advisor to our current president, what reforms regarding Social Security and retirement income would you suggest?
  4. What risks do current and future retirees face in the short term (next five years)?
  5. Are the options for investing in retirement accounts reasonable, too risky, or too limited?

Report on the Economic Well-Being of U.S. Households in 2023-2024

Statement on Signing the Retirement Equity Act of 1984

  1. Use the table below to calculate the taxes that the average worker in the United States who owns a home pays in state and federal taxes.
ItemPercent of Taxes$100,000 Example$200,000 Example
Federal Income Taxes12%, 22%, 24%, 32%, 35%, 37%Use 12% or 22%Use 24%
State Income Taxes (NJ)3.5%, 5.5%,Use 3.5%Use 5.5%
FICA Tax with Medicare7.65%Use 7.65%Use 7.65%
Local Property Tax on a $400,000 property (varies)10%, 15%Use 10%Use 15%
Sales Tax (7% of spending)Calculate as 2% of incomeUse 2%Use 3%
NJ SUI Taxes1%Use 1%Use 1%
Total36.15% to 55.15%  
  • Compare these tax rates to those in a European country or Canada.
  • Find the average cost of what a family pays for medical insurance as a percentage of their income.
  • Deduct expenses for housing (rent or mortgage), food, vacation, medical, transportation, and savings (10%). How much is left?

The Industrial Revolution sparked the first true need for retirement. Assembly lines and factories demanded constant energy from their workers. Pensions began in the 1800s for older workers to help keep productivity up. But during the Great Depression, older workers didn’t want to leave their jobs — and their paychecks — behind. In turn, FDR designed the Social Security Act, effectively birthing the Social Security program so that older Americans could retire financially. The act is the Federal Insurance Contributions Act (FICA) and was signed in 1935 but didn’t begin payouts until 1940. In 1939, Social Security was expanded to include women. When Social Security became law, workers contributed one percent of their income.  Today, they contribute 6.2% and an additional 1.45% for Medicare. Employers match these contributions for a total of 15.3%.

As part of the “War on Poverty,” President Johnson signed the Social Security Act of 1965, which enacted Medicare and Medicaid under the Social Security Administration. In 2018, over 52 million people age 65 and older used Medicare for health insurance.

While President Reagan lowered income taxes, he was the first to make it possible to be taxed on your Social Security benefits in retirement, depending on how much you make. He also raised the full retirement age so that anyone born after 1960 would have to wait until age 67 to receive full benefits. The IRS under the Reagan administration also made it possible to have deductions taken out of employees’ salaries to contribute directly to their 401(k)s — something many workers rely on today.

President Clinton created another level of Social Security taxation, allowing up to 85% taxable benefits depending on how much you make. At the same time, he got rid of the retirement earnings test and prevented the Social Security Administration from blocking retirees from benefits based on earnings.

In 1990, the Older Workers Benefit Protection Act required employers to provide the same benefits for workers over age 65 as younger employees.

In the Unemployment Compensation Amendments of 1992, the rollover rules we know today were implemented. These new rules allowed women who often job-hop to keep their tax-qualified assets protected until retirement.

1993 ushered in the Family and Medical Leave Act (FMLA). This became one of the most important job protections for women after giving birth or providing care for a family member. Now, she could come back to her job and not lose her pay rate.

Although, some consider Social Security as an entitlement, it can be changed by Congress. When workers pay into Social Security, they are contributing to a trust fund instead of a personal account.

Because the combined OASI and DI Trust Funds have accumulated assets of over $2.5 trillion, the excess of program cost over current tax income will be covered by net redemption of these assets in the coming years. It is only when the reserves in the trust funds are exhausted that timely payment of full scheduled benefits becomes an issue. As shown in the chart, at the time of projected trust fund exhaustion in 2037, continuing tax revenue is expected to be sufficient to cover 76 percent of the currently scheduled benefits.

  1. Does the Social Security treat women fairly or equally with men? Do you recommend any reforms?
  2. Should Social Security benefits be taxed or tax free?
  3. What will happen to Social Security benefits when the trust fund has insufficient funds?

Treatment of Women in the Social Security System

Senior Citizens’ Freedom to Work Act

  1. Research the impact of a decision by Congress to make Social Security benefits tax free. Research the impact this will have on the trust fund.
  2. How does full employment and a sustained period of high unemployment above 7% affect Social Security and Medicare.
  3. Calculate the amount of money a worker earning $100,000 pays into Medicare over a period of 40 years and the average costs of what Medicare pays for each person today. Medicare Spending and Finance
  4. How have recent reforms under President Biden affected Medicare spending?
  5. Discuss the impact of reduced Social Security benefits for people when the trust fund is depleted, around 2033.

When a person receives their monthly Social Security check it is most likely deposited directly into their bank account. This allows it to earn interest immediately and to be used for expenses. Look at the Circular Flow of Money diagram below to see how government money is transferred to households and distributed through the local economy.

For example, whether a person receives a Social Security check for $1,000 or $5,000 some of the money goes to banks (financial institutions) and is used for loans to businesses, homeowners, students, etc., to purchase government bonds to support government spending (including Social Security), and for the bank to pay taxes, its employees, and operational costs. Since part of Social Security income is taxable, the federal government receives some of the money back in taxes. Perhaps the most important influence Social Security has on the economy is that people spend the money locally in supermarkets, stores, and restaurants and it saves the government money by keeping people self-sufficient and out of poverty.  This is how money circulates in the economy and creates income for businesses, local and state governments, doctors, and others.

Money also has a Multiplier Effect. The diagram below illustrates the effect of one dollar. As each dollar enters the economy through the purchase of a bagel or donut, the local store expects that sales will continue to increase. As a result, they hire an additional worker, produce more bagels or donuts, and perhaps they will open a second store. As people buy more bagels and donuts, the store needs more flour, butter, cream cheese, coffee cups, etc. The newly hired employee also receives a paycheck for their work and spends it in the community. Basically, think of money multiplying ten times. For each $1.00 spent, the multiplier effect is that it circulated to different people ten times. If the effect of $1.00 is the spending of $10.00 over a month, imagine the impact of a $1,000 Social Security check ($10,000) or a $5,000 Social Security check.

  1. To what extent do government transfer payments (i.e., Social Security) pay for themselves?
  2. What would be the economic effect on the economy if people at the age of 67 did not receive an incentive (Social Security) to retire?
  3. Should people be allowed not to participate in Social Security as an employee?
  4. If Social Security was discontinued, would the effect on the economy be positive or negative?
  1.  Calculate different scenarios if a person should collect their Social Security at age 62, 67, or 70. The scenarios should include individuals who are single, married, in excellent health, divorced, collecting benefits while still working, and for a spouse who did not work and make FICA contributions for the required ten years. Benefit Calculator

According to the Investment Company Institute, “there are more than 710,000 plans, on behalf of about 70 million active participants and millions of former employees and retirees. Savings rolled over from 401(k)s and other employer-sponsored retirement plans also account for about half of the $13.6 trillion held in individual retirement account (IRA) assets as of December 31, 2023.” https://www.ici.org/401k ($13.6 trillion is approximately 1/3 of the federal debt)

The IRA, originally offered strictly through banks, become instantly popular, garnering contributions of $1.4 billion in the first year (1975).  Contributions continued to rise steadily, amounting to $4.8 billion by 1981.

The Economic Recovery Tax Act (ERTA) of 1981 allowed for the IRA to become universally available as a savings incentive to all workers under age 70 1/2.  At that time, the annual contribution limit was also increased to $2,000 or 100% of compensation.

With the passage of the Tax Reform Act of 1986, income restrictions were introduced, limiting the availability of deductible contributions to the TIRA for individuals with incomes below $35,000 (single) or $50,000 when covered by an employer plan.  In addition, provision was made for the Spousal IRA, wherein the non-working spouse could make contributions to a TIRA from the working spouse’s income. 

1996’s Small Business Job Protection Act saw the implementation of the Savings Incentive Match Plan for Employees (SIMPLE IRA), which provided for employer matching and contributions to the employee plans, a viable alternative in many cases to the 401(k), although with more restrictive contribution limits. 

With the Taxpayer Relief Act of 1997, the Roth IRA was introduced.  In addition, phase-out limits were increased, plus the distinction was added for limits on deductible contributions if the taxpayer was covered by an employer-provided retirement plan. The Education IRA was also introduced, with features similar to the Roth IRA (non-deductible but tax-free upon qualified distribution).

In 2001 the Economic Growth and Tax Relief Reconciliation Act (EGTRRA), increased contribution limits with a “catch-up” provision for taxpayers aged 50 and older. An additional provision was the option to convert funds from a Traditional IRA to a Roth IRA, regardless of income level. 

The Consolidated Appropriations Act of 2016 finally made Qualified Charitable Distributions (QCDs) permanent. This feature applies to individuals age 70½ or older and subject to Required Minimum Distributions. The Qualified Charitable Distribution allows direct distributions to charitable organizations (houses of worship, non-profit organizations, etc.) from their IRAs without having to include the amount of the distribution in gross income for the tax year. In 2019, the age for Required Minimum Distributions was changed to age 73½.

As of the most recent reports from 2021, the Investment Company Institute indicates 37% of all American households own an IRA account of some type (over 48 million households). Approximately 27.3 million households have a Roth IRA, holding roughly $1.3 trillion in assets, while traditional IRA are owned by 36.6 million households, holding approximately $11.8 trillion.

Questions:

  1. How will the taxes paid by retirees on their IRA distributions affect the federal budget and national economy?
  2. How does the flow of money from current workers contributing to their Individual Retirement Accounts affect investment firms and the stock market?
  3. Should Social Security and Individual Retirement account changes be allowed or should changes only apply to people who are working and not retired?
  4. Should anyone not participating in the labor force because they are caring for someone in their home be allowed to contribute to Social Security or an Individual Retirement Account?
  5. Should money in an IRA account be allowed to be deposited in a traditional bank savings account of CD that is insured by the Federal Deposit Insurance Corporation?
  6. Should Individual Retirement Accounts replace Social Security for anyone who has not started paying FICA taxes?

Mexican Women Factories: Free Trade and Exploitation on the Border

Reviewed by Thomas Hansen, Ph.D.

Ella Howard studies Mexican women working along the border in “maquilas” or factories, some of the more oppressive ones being referred to sometimes as “sweat shops.”  She conducts a quantitative component in the form of a survey to be completed by women, followed by a qualitative component in the form of one-on-one interviews following up on what is revealed in the surveys.  I focus here on how the book is organized, the kinds of questions Howard asks the women, and some of the topics for students to study.

Howard organizes the book by discussing the history of the border factories and the city of Nogales—which sits in two different countries.  She includes a history of the maquila industry and seeks to discover whether the industry has brought about liberation or exploitation of the women.  She also includes chapters on how she designed her study, what the study revealed, and ways we can think about what she discovered.  She also uses throughout the book the process of comparison-contrast, namely looking both at what is similar and what is different.

Howard poses questions related to both the working and living conditions of the women who are employed in the factories.  She also asks questions related to quality of life, purpose of the work, feelings women develop as a result of their work, demands, schedules, and earnings.  She includes in-depth discussion of the dwellings in which the women find themselves, the kinds of appliances they may have, the floor coverings, the furniture, and the utilities.  Howard reveals some very interesting details indeed about the “colonias” in which the women live.

There is a great deal revealed in this book about Mexican culture, American corporate greed, border communities, poverty, wealth, fairness, and other topics.  The reader will learn so much from looking at the situation, discovering what *NAFTA was supposed to achieve, and digesting the details of how things are for the people directly impacted by all of the new international factories found along the border.  This book is important reading for people who want to consider themselves informed voters, American citizens, and humane persons.

I recommend the book for many readers, but especially for educators dealing with these kinds of topics in their classes: border communities, American business practices, US bills and laws, international trade and business, Mexican culture, gender roles, cultural differences, wealth and poverty, trade agreements, and the both the history and impact of NAFTA.  The book is important as a history textbook, cultural book, and personal reading for teachers.  As educators, it is crucial we include fairness, advocacy, and empathy in our daily work.  It is also good to look at things from more than one perspective.  It is interesting to look at phenomena in their own context sometimes, and also revealing to look at things in a more universal way. 

Book Review: Longing and Belonging: Parents, Children, and Consumer Culture, by Allison J. Pugh

This is a very important book for teachers, teacher trainers, and teacher candidates to read because it offers an explanation of the desires of children and the interesting way the desires are met, or not met, by their parents.  In this day of increasing demand for newer and better toys and technology, children ask for more and more expensive items.

Allison Pugh uses a qualitative research approach from the side of sociology to look at the phenomenon, namely the decision to reward children with gifts or to withhold them, and why or why not.  Pugh looks at the desires and needs of kids from very disparate family backgrounds, socioeconomic class, and racial and cultural experiences in a region of southern California.

The pivotal point is the school, the type of school, including whether it is public or private, and the ways that having technology and other assets are viewed by the students.  The author interviews several parents to find out how the decision is made as to whether the kids will receive something they want.  In some cases, the parents do buy the items so that the kids will not stand out as being too different from others, so that the kids will be able to participate with others in their school and be able to “save face.”

Not all parents immediately purchase items for their child, however, sometimes waiting to make sure it is a wise choice or until the family can afford it.  In other cases, the parents can indeed afford the time but wait before buying it.  The author uses the term “symbolic deprivation” to describe parents waiting until the child truly deserves the item or it is somehow time to go ahead and purchase the gift, toy, or technology.    

In this ethnographic study, the author discovers some surprising aspects many people do not consider.  Parents often want their children to fit in, so buying them fruit snacks or certain kinds of lunch items is very important as they help their kids to be part of the scene.  Some parents consider the social life at school to be as important or even more important than what the kids are learning.  Sometimes parents do try to get children to adopt better eating habits, but they agree to help them fit in better by purchasing trendy snacks or desserts for the lunchbox.

For a variety of reasons, parents do or do not buy certain items.  Parents of all income levels explained it was a struggle to know when to say enough is enough.  In many cases, the parents say they try to buy the majority of the things the kids want, and sometimes that means kids do have to wait so the family will not wind up “in trouble” financially.  Still, though, kids in this study tended to eventually get the lion’s share of what they had on their conscious wish list.

Important reading for educators, this book shows the social and family side of the desires and needs of children in three very different kinds of schools.  Other factors such as class and race place interesting roles in the decision process employed by parents.  It is essential to better understand the kinds of pressures on kids and their parents in terms of the technology and toys so much of the kid landscape these days.  Understanding what is going on behind the scenes, in the lunchroom, and in the playground can be very helpful in comprehending a little more of the kid’s world and that of the parents raising them.

It will be interesting to study these patterns and decisions after COVID-19 has come to a more secure stop at the end of the road.

The Failures of the Recovery from the Great Recession

When Barack Obama took over as President, there were fears that the United States was heading for a re-run of the Great Depression. The financial meltdown that became apparent during calendar year 2008 had sparked a dramatic recession – which has come to be known, with 20-20 hindsight, as the Great Recession. When Obama took office, the economy was hemorrhaging 700,000 jobs a month. The unemployment rate had climbed to 9 percent and was still increasing. Something had to be done.

Obama’s program passed the House and Senate in March of 2009. It was just enough to stop the bleeding and begin what turned out to be a painfully slow recovery. But because of a combination of Democratic timidity and Republican opposition, the size of the macroeconomic stimulation contained in the Recovery Act was much too small. In order to get the 60 votes needed to defeat a Republican filibuster, the Obama Administration had to pare back their proposed spending increases and tax cuts in order to satisfy the deficit hawks among the Democratic majority.

The result was a historically slow recovery which, the writers believe, was the reason the House flipped to the Republicans in 2010, the Senate flipped to the Republicans in 2014, and one of the reasons Donald Trump was elected President at the end of Obama’s two terms. This paper details the macroeconomic impact of the Obama Recovery program and compares several important macro-economic indicators from that recovery (2009-2017) to previous recoveries from recessions in the post-World War II era. The variables investigated include the ratio of investment to gross domestic product (GDP), the rate of growth of productivity, the ratio of consumption to GDP, the unemployment rate, the capacity utilization rate, the employment-to-population ratio, and the rate of growth of real GDP.

The results of the comparisons are striking. Real GDP growth was slow through 2016. Investment incentives were severely damaged by the housing bubble during the years 1995-2005, followed by the housing bubble meltdown during the years 2005-2009. Thus, during the Obama recovery, housing investment barely budged, reducing the overall level of investment. This led to a miniscule productivity growth rate. Meanwhile, consumption spending which is the key incentive for the revival of investment during business cycle upswings rose slowly as well. It also took a long time for the unemployment rate to fall to its pre-recession level.

This disappointingly sluggish recovery was the culmination of a number of long run trends that had slowed the economy during the entire period since the early 1970’s including the long-term slowdown in GDP growth per capita since the early 1980s.

During the Obama recovery, the unemployment rate declined very slowly. Obama won re-election but up and down the ballot – including in many state legislatures and the House of Representatives beginning in 2010 – Republicans cashed in on the impatience of citizens with the slow pace of recovery. The economy did not get back to “normal” until 2016 but it was too late for the Democrats. Trump was able to ride to a razor thin victory in part on the strength of disappointment by many people who had voted for Obama – both rural whites in key states like Wisconsin and Michigan who switched to Trump, as well as Black voters whose turnout fell in Detroit, Philadelphia, Pittsburgh and Milwaukee with devastating electoral consequences for three crucial battleground states (Krogstad and Lopez, 2017).

When President Obama took office, all eyes were focused on the short-run challenge of the Great Recession. Here’s how his Council Of Economic Advisers stated it, a year later, in the Economic Report of the President, 2010:

“In December 2007, the American economy entered what at first seemed likely to be a mild recession. … [R]eal house prices (that is, house prices adjusted for inflation) had risen to unprecedented levels, almost doubling between 1997 and 2006. The rapid run-up in prices was accompanied by a residential construction boom and the proliferation of complex mortgages and mortgage-related financial assets. The fall of national house prices starting in early 2007, and the associated declines in the values of mortgage-backed and other related assets, led to a slowdown in the growth of consumer spending, increases in mortgage defaults and home foreclosures, significant strains on financial institutions, and reduced credit availability.

By early 2008, the economy was contracting. Employment fell by an average of 137,000 jobs per month over the first eight months of 2008. Real GDP rose only anemically from the third quarter of 2007 to the second quarter of 2008.

Then in September 2008, the character of the downturn worsened dramatically. The collapse of Lehman Brothers and the near-collapse of American International Group (AIG) led to a seizing up of financial markets and plummeting consumer and business confidence. Parts of the financial system froze, and assets once assumed to be completely safe, such as money-market mutual funds, became unstable and subject to runs. Credit spreads, a common indicator of credit market stress, spiked to unprecedented levels in the fall of 2008. The value of the stock market plunged 24 percent in September and October, and another 15 percent by the end of January. [O]ver the final four months of 2008 and the first month of 2009, the economy lost, on average, a staggering 544,000 jobs per month, the highest level of job loss since the demobilization at the end of World War II. Real GDP fell at an increasingly rapid pace: an annual rate of 2.7 percent in the third quarter of 2008, 5.4 percent in the fourth quarter of 2008, and 6.4 percent in the first quarter of 2009” (ERP, 2010: 26-27).

Here is how President Obama himself described the crisis that greeted him when he took office:

“Last January, (2009) years of irresponsible risk-taking and debt-fueled speculation—unchecked by sound oversight—led to the near-collapse of our financial system. We were losing an average of 700,000 jobs each month. Over the course of one year, $13 trillion of Americans’ household wealth had evaporated as stocks, pensions, and home values plummeted. Our gross domestic product was falling at the fastest rate in a quarter century. The flow of credit, vital to the functioning of businesses large and small, had ground to a halt. The fear among economists, from across the political spectrum, was that we could sink into a second Great Depression” (ERP, 3).

Later in the same message he noted that there were also long-term problems that his administration had to confront:

“At the same time, long before this crisis hit, middle-class families were under growing strain. For decades, Washington failed to address fundamental weaknesses in the economy: rising health care costs, growing dependence on foreign oil, an education system unable to prepare all of our children for the jobs of the future. In recent years, spending bills and tax cuts for the very wealthiest were approved without paying for any of it, leaving behind a mountain of debt. And while Wall Street gambled without regard for the consequences, Washington looked the other way.

As a result, the economy may have been working for some at the very top, but it was not working for all American families. Year after year, folks were forced to work longer hours, spend more time away from their loved ones, all while their incomes flat-lined and their sense of economic security evaporated. Growth in our country was neither sustained nor broadly shared. Instead of a prosperity powered by smart ideas and sound investments, growth was fueled in large part by a rapid rise in consumer borrowing and consumer spending” (ERP, 5-6).

The Council of Economic Advisers elaborated a bit more on these long-run problems:

“…even before the crisis, the economy faced significant long-term challenges. As a result, it was doing poorly at providing rising standards of living for the vast majority of Americans…Beginning around 1970, slower productivity growth and rising income inequality caused incomes for most families to grow only slowly. After a half-decade of higher growth in the 1990s, the real income of the typical American family actually fell between 2000 and 2006” (ERP, 28).

As to what had caused the increase in inequality and slower productivity growth over the long run, the Council members were silent. They did, however, identify a rising share of debt-financed consumption as the problem for the decade since 2000:

“The expansion of the 2000s was fueled in part by high consumption. [T]he share of GDP that takes the form of consumption has been on a generally upward trend for decades and reached unprecedented heights in the 2000s. The personal saving rate fell to exceptionally low levels, and trade deficits were large and persistent. A substantial amount of the remainder of GDP took the form of housing construction, which may have crowded out other kinds of investment. Such an expansion is not just unstable, as we have learned painfully over the past two years. It also contributes too little to increases in standards of living. Low investment in equipment and factories slows the growth of productivity and wages” (ERP, 29-30).

In order to assess whether the Obama Administration’s plan for recovery from the Great Recession was a success or failure, one must first explain how to judge success or failure. In the Economic Report of the President for 2017, Obama’s Council of Economic Advisers certainly argued that what they had done since January 2009 had been a great success. Here is how they argued:

“Over the two terms of the Obama Administration, the U.S. economy has made a remarkable recovery from the Great Recession. After peaking at 10.0 percent in October 2009, the unemployment rate has been cut by more than half to 4.6 percent as of November 2016 … Real gross domestic product (GDP) per capita recovered fully to its pre-crisis peak in the fourth quarter of 2013, … As of November 2016, the economy has added 14.8 million jobs over 74 months, the longest streak of total job growth on record. Since private-sector job growth turned positive in March 2010, U.S. businesses have added 15.6 million jobs. Real wage growth has been faster in the current business cycle than in any since the early 1970s” [ERP: 217: 21].

The forceful response of the federal government to the crisis in 2008 and 2009 helped stave off a potential second Great Depression by setting the U.S. economy on track to rebuild, reinvest, and recover. Everything the Obama Council of Economic Advisers marked in their 2017 report is correct. Their emphasis on the importance of both the fiscal stimulus of the Recovery Act, and the temporary payroll tax holiday is not misplaced. Unfortunately, because of the political constraints on big deficits and the almost universal opposition of the Congressional Republicans, the Obama Administration had to be content with a fiscal stimulus, despite being the largest in the post-World War II economy, turned out to be woefully insufficient.

What was left out of the Council of Economic Advisers’ celebration of the successes of the post 2009 recovery was a sense of how the post 2009 period – the period of recovery according to the National Bureau of Economic Research’s Business Cycle Dating Committee – compared with recoveries from previous recessions. In general, it is essential that such comparisons be made across the board so that we can judge whether a particular set of policies was successful or not. The economy did recover. By the time Obama left office in 2017, all economic indicators were significantly better than they were when he took office. If that is all the evidence that is needed, then every President from Truman to Obama, except Jimmy Carter, George H.W. Bush and Donald Trump, represents an economic success story.

However, if we are going to use the comparative analysis, we have to compare apples to apples. Our comparative data will cover the quarters of recovery — from the trough to the peak. We will compare the data for the recovery from the Great Recession with previous recoveries going back to the 1961-70 period. As always, we will use the quarters of recovery as identified by the NBER’s Business Cycle Dating Committee.

The next, and most significant question is: What are the standards of success? We have already indicated that the rate of growth of real GDP per capita is a crucial element of economic success. But growth has never been smooth. From the initial discovery back in 1819 that there is a “business cycle,” it has been apparent that economies organized by some variant of free-market capitalism grew by fits and starts surging forward in periods of growth, only to have them interrupted by what were called in the 19th century “crises.” Long run economic growth was powered by such surges of expansion. It is during these surges (officially called recoveries in the literature these days) that improvements in productivity occur for the most part because of high levels of private investment.

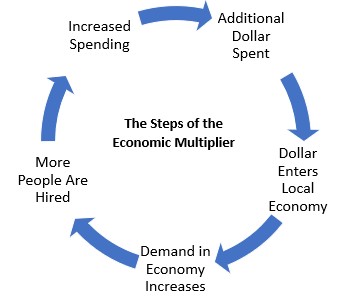
Investment and productivity growth represent the “supply side” of economic growth. But investment actually does dual duties because it is the most dynamic element in aggregate demand. When it is rising rapidly (evidenced by a high ratio of investment to GDP) it stimulates an increase in aggregate demand. When that ratio falls, it causes slowdowns and even recessions. These swings in investment have ramifications via the multiplier effect on consumption, by far the largest contributor to the “demand side” of economic growth. While investment changes introduce the major dynamic into the system, it is the growth of consumption that sustains it. Sometimes, export surges can play an important role and during wartime government spending plays a major role as well.

Meanwhile, productivity growth is the process that enables economic growth. All investments both in physical and human capital increase the capacity of the economy to produce. To the extent that the investment utilizes the newest technology, it plays a major role in increasing productivity. An increase in productivity makes it possible for wages to increase without cutting into profits, and for profits to increase without depressing wages. Thus, a higher rate of productivity growth during a period of economic recovery indicates that the economy is doing well, whereas a slowdown in productivity growth indicates the opposite. Though journalists, politicians and the public usually see GDP growth as the key to an economy’s success, from an economists’ point of view the gold standard of success is a high rate of productivity growth – because that facilitates higher economic growth and a rising standard of living.

So the rate of growth of productivity and the ratio of investment to GDP are both extremely important indicators of economic success. For investment, the standard of success is whether there is a relatively high ratio to GDP, which would show investment playing a very positive role. A relatively low ratio to GDP shows that investment is failing to provide the important dynamic element. The ratio of consumption spending to GDP shows how a growth spurt is sustained.

Our final standards of success relate to how close our economy comes to meeting its potential during a period of expansion. The usual standard of success, and the one that often has important political ramifications, is the civilian unemployment rate. Unemployed resources represent a waste of potential. In this paper, we choose to use three variables representing three different ways to measure the closeness to potential experienced during a recovery: unemployment, capacity utilization and the employment to population ratio. Though unemployment is the one most quoted in the media, there has always been an argument within the economics profession about how much unemployment is “voluntary.” Voluntary unemployment is not a waste of potential as the individual making the decision is unwilling to commit that potential to employment.

To further complicate the idea that the civilian unemployment rate measures a waste of human resources, we have the argument introduced by Milton Friedman that there is a “natural” rate of unemployment. That concept has been joined by the idea that there is a “non-accelerating-inflation rate of unemployment” (or NAIRU). At either or both of these rates, which have never been precisely identified numerically and which have changed from time to time, one could argue that the economy is not wasting resources because rates of unemployment below either the “natural” rate or the NAIRU are unsustainable.

In order to avoid arguing about how much of measured unemployment is truly involuntary, we also present the capacity utilization rate. This is a true measure of deficiency of aggregate demand because except for some minimal downtime for either routine maintenance or re-tooling, excess capacity is a clear waste of economic resources. Finally, the employment to population ratio avoids the knotty issue of how many people without jobs are truly not in the labor force. It captures the discouraged workers who never get counted in official unemployment statistics while still underestimating the under-utilization of human resources because it fails to measure involuntary part-time work. We believe all three of these statistics can give us a sense of how close to optimum utilization of resources an economy comes during a period of expansion. We also note that the impact of government spending, as evidenced by the data, was insufficient to propel a vigorous recovery given the severity of the downturn and the deep dive in the investment to GDP (I/GP) ratio.

With this plan, we can now turn to actually measuring the recovery from the Great Recession against previous recoveries starting with the 1961-70 recovery. The quarters between the troughs (1961, 1970, 1975, 1982, 1991, and 2001) and peaks (1969, 1973, 1980, 1990, 2001, and 2007) provide our data for the comparisons with the recovery from the Great Recession. In order to avoid the impact of compounding over recoveries of different lengths, we utilize averages over the course of each recovery as the basis for comparisons.

To assess the recovery from the Great Recession, we begin in the second quarter of 2009, and end when Obama left the White House in the first quarter of 2017. Even though the recovery did not end until the Covid-19 pandemic threw the economy into a very deep recession in the second quarter of 2020, our job is to describe the economy during Obama’s administration. First look at the ratio of gross investment to GDP. The reason we use gross investment rather than net investment is because even though the depreciation part of gross investment does not involve any net increase in the capital stock, the capital bought to replace that part of the capital stock that is “wearing out” will fix the newest technology and thus contribute to economic growth. In addition, the spending to replace wearing out capital has a multiplier effect just like any other spending.

Taking every recovery going back to 1961, all recoveries showed an average I/GDP ratio above 17 percent except for the 1961-70 recovery where investment as a percentage of GDP was below that level. The recovery from the Great Recession was significantly lower than the previous recoveries averaging just over 16 percent.

But that does not fully capture the seriousness of the problem. When President Obama took office, the I/GDP ratio was 12.7 at the trough of the Great Recession. Unfortunately, unlike some earlier recessions (1974 and 1982 for example), when the ratio rebounded dramatically (reaching 17% in 1976 and over 20% in 1984). It took three years between 2009 and 2012 for the I/GDP ratio to reach 15.5%. It averaged only 16.2 percent of GDP for the entire period through 2017Q1 and in fact never broke 18% until after 2017. The reason for the sluggish recovery of investment is easy to see, the fall in residential housing investment that had been the proximate cause of the Great Recession. From a ratio of 6.6 % of GDP in 2006, housing investment plummeted to 2.6 % of GDP at the depth of the Great Recession and had slowly climbed only to 3.9 % of GDP by the end of President Obama’s second term. This ratio was lower than the previous nadir of residential investment as a percentage of GDP at the end of the 2001 recession (4.8%). If housing investment had just returned to that level, overall investment would have broken 18% significantly earlier.

Because investment is the driving force of the economy’s dynamic, we should expect that the sluggish recovery of the I/GDP ratio to have a significant impact on the rate of growth of productivity, the rate of growth of the economy, and the variables that measure how close to potential (sufficiency of aggregate demand) the economy is. Sure enough, the numbers bear this out. The rate of growth of productivity was most dramatic in the 1961-70 recovery, averaging over 3 percent per quarter. After disappointing numbers in the 1970s, the rate of growth of productivity averaged 2 percent or higher per quarter over the three recoveries beginning in 1982 – averaging 2.6 percent between 2001 and the end of 2007 which was the peak before the Great Recession. Unfortunately, the disappointing numbers from the 1970s returned with a dismal 1.1 percent average in productivity growth over the entire recovery period through the first quarter of 2017. That coupled with disappointing numbers for unemployment, (7.3 percent average) capacity utilization (75.8 percent average) and especially the employment-to-population ratio (58.9 percent average) combine to explain the disappointing overall per capita GDP growth.

Except for the recovery from the dot-com bubble recession (2001-2007), every recovery going back to the 1960s had experienced per capita GDP growth averaging 2.5 percent or better. But as the economy struggled to slowly rise from the trough of the Great Recession the rate of growth of per capita GDP averaged only 1.4 percent per quarter through 2017. That is even lower than the 1.9 percent in the 2001-2007 recovery.

The unemployment rate had been trending upwards since the 1961-1970 recovery, averaging over six percent per quarter beginning with the 1971-74 recovery until the recoveries of 1991-2000 and 2001-2007 where the rates were 5.5 percent and 5.3 percent respectively. Similarly capacity utilization has been trending down since the robust 86 plus percent in the 1961-70 period. After an upward move in the 1991-2000 recovery, it resumed its downward trajectory, ending up averaging the lowest since World War II over the recovery from the Great Recession. The same trend appears in the employment-to-population ratio, which jumped up to an average of 63 percent in the 1991-2000 recovery only to average 58.9 percent in the recovery since 2009.

This is where the insufficiency of the macro-economic stimuli engaged in by the Obama administration (and we repeat, we understand how they were politically constrained, especially after “the worst” of the Great Recession had passed and the economy was clearly in recovery) reveals itself. The extraordinary nature of the deep dive that occurred in investment and the growth of GDP called for a significantly bigger stimulus to aggregate demand than in previous periods. Government spending at levels similar to previous business cycle recoveries was not enough.

The only departure from previous government stimuli during recoveries was the increase in transfer payments. Unfortunately, this only has a multiplier effect through its impact on consumption but the data shows that the ratio of consumption to GDP was less than a half a percent higher than in the previous recovery. There is no question that the federal spending stimulus would have had to be much higher than it was for the recovery to have any hope of being as good as previous ones.

We contend that despite the laser-like focus of the Obama Administration on getting the economy moving again as symbolized by the Recovery Act’s unprecedented explicit efforts to use fiscal policy to induce a robust recovery (the Congressional Budget Office concluded that the Recovery Act provided a stimulus spending level of $739 billion), it did not come close to closing an aggregate demand shortfall that was estimated conservatively at $1.2 trillion.

It is also important to add that the Federal Reserve’s expansive monetary policy seemed to have no positive impact on investment, particularly the interest sensitive housing sector, given the free fall of the housing market after the collapse of the bubble – almost a textbook example of the simple argument that the Fed cannot push on a string.

Initially, the Recovery Act did what it was supposed to. The federal budget deficit ballooned to 9 percent of GDP in 2010 and the unemployment rate began to fall. But when the Recovery Act spending began to peter out, the Republicans who had taken control of the House in 2010 forced the Obama Administration to compromise and agree to a set of spending restraints knows as a “sequester.” The result was that the federal deficit, the major impetus to the economy when investment spending lags, fell so that by 2013 it was only a bit over 4 percent of GDP.

Thus, it took all the way to 2015 for the unemployment rate to get back to what it had been before the Great Recession. This long, laborious struggle by the economy just to get back to square one, no doubt due to the fact that the I/GDP ratio never achieved the peak it had reached in the previous four recoveries.

In this extraordinary period when the economy was attempting to dig itself out of the hole created by short-run financial meltdown and the bursting of a housing bubble that left residential investment way below recent levels for the entire course of the recovery, a much higher level of government stimulus would have been necessary. Obviously, the Obama Administration and its allies in Congress cannot be totally faulted for this because after 2010, Republicans were in control of the House of Representatives and after 2014, Republicans took control of the Senate as well. The Obama Administration did make efforts to get an infrastructure bill passed a number of times but the Republicans in Congress blocked them. Despite wholesale opposition, the Obama Administration was able to increase stimuli via a temporary suspension of two percent from the Payroll Tax. They were able to do this by delaying the automatic expiration date of the George W. Bush tax cuts, scheduled to sunset after 2010, for two years which got Congressional support for the payroll tax holiday and expansion of unemployment compensation. After 2013, some of those tax cuts were made permanent while the payroll tax holiday ended. Unfortunately, the initial proposal for the Recovery Act was much too low and in order to get 60 votes in the Senate to break a Republican filibuster against it, the initial proposal was cut back slightly.

The economy is not just numbers like GDP and Investment. Ultimately, the key to economic well-being is the real income of ordinary Americans. We believe that the statistic identified as the median income of year-round full-time workers is indicative. Beginning in the third quarter of 2009, by the first quarter of 2017, the weekly real earnings of workers over 16 had risen the grand total of 2.03% for an average of about .28% a year. These were significantly lower than in previous recoveries though it is fair to say, median income growth was very slow for the entire period after 1980.

With 20-20 hindsight, the initial bill should have had a section that called for spending the same amount again if after two years, the unemployment rate had not fallen substantially. Given that previous deep sharp recessions (1974, 1981-82) experienced strong rapid recoveries, such a provision might have been sold as “insurance” against such a sluggish recovery and might have passed. But of course, hindsight is always 20-20.

The unfortunate result of the fact that the recovery from the Great Recession was much too slow and that median incomes of ordinary Americans hardly budged during the recovery was the high level of dissatisfaction within large swaths of the American people. Though there are many reasons for the surprise victory of Donald J. Trump in the 2016 election, one element that clearly contributed to it was the failed recovery from the Great Recession.

References

ERP (2010). Economic report of the President. Council of Economic Advisers.

ERP (2017). Economic report of the President. Council of Economic Advisers.

Krogstad, J.M. & Lopez, M.H.  (2017, May 12). “Black voter turnout fell in 2016, even as a record number of Americans cast ballots.” Pew Research Center.

Modern Neocolonialism Via Public and Private Entities

For over five centuries, opportunistic outside powers have been taking advantage of Latin America. During the colonial era, the natural resources and native populations of the region were abused by European countries for profit. Exploitative practices left indelible marks on the area that persist to this day, and even after achieving independence, many countries in the region continue to function under neocolonial domination. Through the direct actions of foreign governments and more subtle acts of economic manipulation, the will of the people in Latin America has been continuously suppressed by intruding parties. In this essay, I will argue that modern neocolonial influence in Latin America largely follows historical precedent. Political and economic affairs in the region are shaped by modern foreign interests in the same manner that they have been throughout history.

With the advent of lithium-ion batteries and their increased popularity in the search for clean energy sources, global interest has been shifted back towards the Latin American mining industry. The trio of Bolivia, Chile, and Argentina contain about 58 percent of all global lithium reserves, a resource which is highly valuable on the global market (Berg et. al. “South America’s Lithium Triangle” 2021). Consequently, multiple global superpowers have expressed interest in gaining partial-or total-control over South American mining operations. In the first document that I chose, “South America’s Lithium Triangle: Opportunities for the Biden Administration”, authors Ryan C. Berg and T. Andrew Sady-Kennedy suggest that the Biden administration should pursue a higher level of cooperation between the United States and the countries mentioned above. Citing environmentalist concerns, green energy, and the rapidly expanding demand for lithium, the two argue that it would be mutually beneficial for all parties to work together (Berg et. al. “ South America’s Lithium Triangle” 2021). On its own, this suggestion seems innocent enough. Alternative energy is a burgeoning market, and the modern globalized economy means that investment from foreign sources is not uncommon by any means. However, when the current political climate in these lithium-producing countries is considered, it becomes more clear that the United States’ plans for involvement are not in line with the ideals that these countries have embraced. The elected governments of Argentina, Bolivia, and Chile all express heavy left-leaning ideologies, which are largely incompatible with the concept of investment as it is understood in the article. The newly elected president of Chile, Gabriel Boric, has even suggested that he will seek to nationalize the country’s mining industry, a move that would likely cease all involvement from the United States (Restivo 2021). Berg and Sady-Kennedy briefly address these barriers, noting the “United States’ historically rocky relationship with both Argentina and Bolivia”, but they do not seem to view them as particularly significant (Berg et. al. “South America’s Lithium Triangle” 2021). To the authors, such concerns can simply be solved by organizing a summit between lithium-producing countries and potential investors (Berg et. al. “South America’s Lithium Triangle” 2021). No credence is lent to the possibility of countries being disinterested in such a summit. Such arrogance is reminiscent of that displayed by those seeking to spread European-style “progress” into Latin America during the 19th Century. As described in “Neocolonial Ideologies” by E. Bradford Burns, it was inconceivable to Europeans that anybody would disagree with their conception of the optimal society. Burns puts it as such: “…the Enlightenment philosophers concluded that if people had the opportunity to know the truth, they would select ‘civilization’ over ‘barbarism’” (Burns 1980:92). Of course all Latin American people would pursue an industrialized society, as it was objectively the civilized, superior manner of existence. Berg and Sady-Kennedy demonstrate a similar pattern of thinking. Of course Bolivia, Chile, and Argentina would meet with the United States to discuss investment, because it is objectively the best way for them to boost said investment.

This article frequently invokes the ideas of partnership and cooperation, but it subtly betrays its true intentions in one key statement. After discussing the newfound usefulness of lithium and the growing market for it, Berg and Sady-Kennedy say the following: “These trends indicate that control of the lithium industry could reap major benefits in the future…” (Berg et. al. “South America’s Lithium Triangle” 2021). Notable in this excerpt is the usage of the word “control”. Unlike partnership and cooperation, the idea of control carries a much different -and much more sinister- connotation. It implies a much more forceful involvement, one in which the will of the United States is imposed instead of negotiated. This, of course, is the most familiar modus operandi of the United States. It can be traced back almost two full centuries to the Monroe Doctrine, expressed in 1823. The Doctrine, presented to Congress by President James Monroe, granted the U.S. permission to involve itself in Latin American affairs “in which the rights and interests of the United States are involved” (Avalon Project 2008). There are shades of this approach visible in the article, as Berg and Sady-Kennedy establish that the lithium industry is very much of interest to the United States. However, the authors seem to push beyond this concept and into the realm of the Roosevelt Corollary. The Roosevelt Corollary granted the United States power to exercise more force in its application of the Monroe Doctrine, under the guise of “[desiring] to see the neighboring countries stable, orderly, and prosperous” (Frohnen 2008). It drew heavily from the idea of paternalism, which is based upon the belief that some groups of people are more capable and intelligent than others. This feigned desire to see Latin American countries succeed, as well as the paternalistic tone of the Corollary, can be seen throughout the article. The failure of Chile, Bolivia, and Argentina to “successfully [transform] the majority of [their] available resources into economically viable reserves available for commercial production” is bemoaned, and it is heavily insinuated that the United States is responsible for reversing this trend (Berg et. al. “South America’s Lithium Triangle” 2021). The exact words of the Monroe Doctrine and the Roosevelt Corollary are much too taboo for modern-day political analysts, but clearly the sentiments expressed within them are still relevant and popular.

The United States is far from the only country perpetuating modern neocolonialism in Latin America. In its efforts to expand its social and economic influence, China has begun to get involved in the region, with much more obvious and direct intentions. Thus, for the second document in this analysis, I chose “Chinese Neocolonialism in Latin America: An Intelligence Assessment”, written by senior airman Steffanie G. Urbano and produced by the U.S. Air Force. The report enumerates a few different grievances that the United States has with China’s action, starting with exploitative lending and the weaponization of debt. Urbano describes a process known as “debt diplomacy”, in which China will issue exploitative loans to Latin American countries that do not have the ability to pay them back. The debt from these loans is then used as leverage by China, allowing them to hold other countries hostage when they cannot repay. This allows China free reign to operate in the region, with actions like seizing key infrastructure and forcibly reworking government contracts being common (Urbano 2021:185-187). China’s strategy of leveraging debt is not unheard of in Latin America; in fact, it is particularly reminiscent of the blueprint set by Europe in the 19th and 20th centuries. During this time, major European powers kept newly independent Latin countries in a state of perpetual debt, taking advantage of their young governments and economies. When these countries inevitably defaulted on their loans, loaning countries used it as an excuse to exercise military power and generally institute their own will. In Born in Blood & Fire, John Charles Chasteen lays out a particularly prominent example from Mexico in the mid-1850s: “The civil war had bankrupted the Mexican state, and Juárez suspended payment on foreign debt. France, Spain, and Britain retaliated by collectively occupying Veracruz” (Chasteen 2016:169-170). Using Veracruz as a springboard, the French military invaded the country, kicked out the current government, and installed their own puppet dictator to rule the country on their behalf. This particular brand of gunboat diplomacy is outdated in modern times, but the utilization of debt to excuse aggressive behavior is very much alive. Beyond debt diplomacy, Urbano also notes that large numbers of Chinese immigrants are settling in Latin America. She points to the fact that the Chinese-born population in the area more than doubled from 1990 to 2015, an increase which was sparked by “the migration of families to join Chinese laborers already settled in Latin America” (Urbano 2021:192). This is another familiar strategy, one that was used in the American banana republics in the early 20th century. The United Fruit Company, who effectively controlled much of Central America, created entire towns and communities of U.S. expats. Employees and their families would live in neo-suburban settings, “miniature US neighborhoods of screen-porched houses on meticulously manicured lawns”, isolated at best and actively colonizing at worst (Chasteen 2016:200-201). They spread American culture and ideas into the region, contributing little in the way of actual development and improvement. This parasitic relationship serves as the clear inspiration for China to develop their own isolated communities abroad.

Besides being deeply ironic, the contrasting tones of these two articles demonstrate the power of American exceptionalism to color our perception of the world. How can our government condemn “the detrimental impact of [Chinese-Latin American relationships] on regional stability and US leadership” when it has been just as guilty of destabilizing the region (Urbano 2021:184)? Why is it unacceptable for China to take control of key industries while American think tanks advocate for the same behavior? Do we truly believe that Latin America is only now becoming “overrun by malicious intent”, and that U.S. intervention “to keep our neighborhood friendly” is not malicious (Urbano 2021:197)? After analyzing both of these pieces, it has become clear that the United States sees itself in a different light from other countries. Ryan Berg and T. Andrew Sady-Kennedy advocate for intervention in the lithium industry because they believe that the U.S. must help Argentina, Bolivia, and Chile. They acknowledge that those countries do not want our assistance, but they seem to believe that such relationships can be changed purely by virtue of being the United States. Airman Urbano strongly condemns Chinese intervention in Latin America through the entirety of her writing, but she ends by advocating for U.S. intervention in the region. She seems to believe that the United States has more virtuous and respectable aims in the region, despite a history that suggests otherwise. Only by learning this history can we break such patterns of thinking and work towards achieving justice for the people of Latin America.

            Although this essay was previously drafted for a college level course, the ideas and the process demonstrated within it could prove useful in any social studies classroom that utilizes document analysis. When working with historical documents, it is important for students to recognize that the content within the document does not exist outside of its historical context. Effective analysis in the classroom should always include a dissection not only of the content itself, but the author, the intended audience, the reasons for the document’s creation, and the broader historical environment in which it was produced. In the above essay, we can see this process being taken with the Berg and Sady-Kennedy article and the broader context of U.S. policy in Latin America. As acknowledged by the author of this essay, the literal verbiage of the article is fairly innocent and mundane, with Berg and Sady-Kennedy advocating for cooperation and partnership in the region. When the historical context of the Monroe Doctrine and interventionist policy is considered, though, the article’s messaging becomes a more concerning indicator of contemporary views about Latin America in the United States.

 For students in a secondary education setting, the skill of recognizing and defining a document’s subtext should be targeted for development. Educators can promote this skill by highlighting the aforementioned aspects (author, audience, intention, context) of documents that are used in class, thereby modeling the process for students. This can be scaffolded as well, with educators prompting students to undertake the analysis process on their own until it becomes an automatic part of dissecting a document. If students can effectively utilize this skill, teachers can incorporate a much broader range of documents into the classroom. Material does not need to be nearly as literal and targeted if students possess the ability to consider historical context. For example, a lesson on racial discrimination could incorporate writings about eugenics, redlining, discriminatory legal codes, and much more provided that students are able to recognize the racial connotations of these issues. Outside of the classroom, this skill is just as valuable. Politically active Americans will frequently encounter messaging that relies heavily on connotations and subtext to execute its true intentions. In order to function as a responsible and informed member of our democracy, an individual must be able to pick up on the messaging beneath the surface.

Berg, Ryan C. and Sady-Kennedy, T. Andrew. 2021. “South America’s Lithium Triangle: Opportunities for the Biden Administration.” Retrieved from https://www.csis.org/analysis/south-americas-lithium-triangle-opportunities-biden-administration <Accessed 4/22/22>  

Burns, E. Bradford. 1980. “Neocolonial Ideologies.” In The Poverty of Progress: Latin America in the 19th Century. Berkeley: University of California Press. Pp. 18-20, 29-30.

Chasteen, John. 2016. Born in Blood & Fire. New York:W.W. Norton & Company.

Monroe, James. Monroe Doctrine, December 2, 1823. In The Avalon Project: Documents in Law, History, and Diplomacy. New Haven: Lillian Goldman Law Library, 2008.

Restivo, Néstor. 2021. “Cuál es el programa económico de Gabriel Boric para el nuevo Chile.” Pagina 12. December 26.

Roosevelt, Theodore. Roosevelt Corollary to Monroe Doctrine, December 6, 1904. In The American Nation: Primary Sources, edited by Bruce Frohnen. Indianapolis: Liberty Fund, 2008.

Shakow, Miriam. 2022. “Findlay Intro & Ch 1-2 plus Roosevelt Corollary.” Class Lecture, Race & Gender in Latin America. The College of New Jersey. April 8.

Urbano, SrA Steffanie. 2021. “Chinese Neocolonialism in Latin America.” Journal of the Americas. Third Edition 2021: 183–199.

Health Care Off the Books: Poverty, Illness, and Strategies for Survival in Urban America

Health Care Off the Books:  Poverty, Illness, and Strategies for Survival in Urban America, by Danielle T. Raudenbush, (Oakland: University of California Press).

Review by Thomas Hansen

Teachers of social studies—and all teachers interested in social justice—can make good use of this text as either a good reference for their personal library or a good research source for students in secondary school courses to read and consult.  There is a great deal of good information here about healthcare and healthcare policies in the US.  The book is written in accessible language and does not appear to have any offensive passages.

Danielle T. Raudenbush explains the ways in which poor urban dwellers in a project navigate the challenging world of health care, some with insurance, some without.  Raudenbush shows us there are three different levels of approaches to getting the needed pills, bandages, and even medical equipment whether patients follow the formal approach to getting their healthcare—or not.

The author makes it clear there is a consistent and reliable informal network of helpers for poor persons to get pretty much whatever they need on the streets.  Raudenbush acknowledges this particular qualitative study, done over time, focuses very much on healthcare issues and does not address food, money, rides, or other items very much. 

The author shows us there are those three different approaches, first formal: going to doctor appointments, buying medication and/or using insurance to do so, and then taking all of the medication/following all the doctor’s orders, and convalescing as directed.  There is also informal—and this is the one that seems to be of most interest to the author.

A second approach is “informal” and it involves using local resources and persons in the process of purchasing or trading for the pills, bartering for the pills, lending other needed medical supplies and goods, or purchasing these items from a helper in the project.  It is very interesting how the author is able to get so much information, and she has established very good rapport, it seems, with the residents of the project.  Like her subjects in the study, the author is African-American, and this connection helps her to get the trust of the people she interviews.  She also conducts focus groups with the residents.

A third approach—she calls it the “hybrid” one, shows local and formal together.  The author reveals how much the residents of the project bend rules, make important connections, share resources, and make use of the people who serve as “helpers” in that community.  Doctors and other medical personnel are also involved in the hybrid approach in various ways—and in the informal approach too.

Helpers provide the backbone for the poor to get access to so many services, and to food, and to medication, and even to walkers and wheelchairs.  Often heard among the homeless, also, are these kinds of questions:

  • Who is giving away winter coats?
  • Who has free dinner tonight?
  • Is there any place with decent sack lunches by my spot where I stay now?
  • Where can I get some gloves and underwear on a Sunday?
  • How do I find that lady who has the phone chargers for sale?

In addition to these questions, helpers often have to deal with others—such as ones dealing with social security application rules, where to get free aspirin, how to get disability checks, how to find a good dentist who takes XY or Z insurance, and other needed information.  As in this book, one will find out the streets have helpers who are constantly assisting those in need—and who are well-known among the street networks. 

Informal networks and devoted helpers are an integral part for many residents of that project.  The author does a great job of show how complex the relationships can be.

Ages of American Capitalism: A History of the United States

Ages of American Capitalism: A History of the United States

by Jonathan Levy

A leading economic historian traces the evolution of American capitalism from the colonial era to the present—and argues that we’ve reached a turning point that will define the era ahead. Levy reveals how capitalism in America has evolved through four distinct ages and how the country’s economic evolution is inseparable from the nature of American life itself. “Wealth is power, and power is wealth. The aphorism commonly attributed to the Englishman Thomas Hobbes, author of the great political philosophical treatise Leviathan (1651), was later invoked by Adam Smith in the greatest treatise ever written on commerce, An Inquiry into the Nature and Causes of the Wealth of Nations (1776). Smith was a Scot, not an American, but up until 1776, Scots and Americans shared something in common: both were subjects of the British Empire. In the Age of Commerce, empire and capitalism grew up together.” The Age of Commerce spans the colonial era through the outbreak of the Civil War, and the Age of Capital traces the lasting impact of the industrial revolution.

The volatility of the Age of Capital ultimately led to the Great Depression, which sparked the Age of Control, during which the government took on a more active role in the economy, and finally, in the Age of Chaos, deregulation and the growth of the finance industry created a booming economy for some but also striking inequalities and a lack of oversight that led directly to the crash of 2008. Jonathan Levy is a professor in the Department of History at the University of Chicago. His book, Freaks of Fortune: The Emerging World of Capitalism and Risk in America, won the Organization of American Historians’ Frederick Jackson Turner Award, Ellis W. Hawley Prize, and Avery O. Craven Award.

Modern Monetary Theory for Social Studies Educators: A New Perspective on an Old System

Modern Monetary Theory for Social Studies Educators: A New Perspective on an Old System

Erin C. Adams
 

Economics is a discourse built on figurative language, metaphors and folksy sayings (McCloskey, 1983). Former U.S. Representative Jack Kingston (Republican, GA) repeated one of the field’s best known sayings when he suggested that K-12 students should “pay a dime, pay a nickel” or better yet “sweep the floor of the cafeteria” in order to learn “there is in fact no such thing as a free lunch” (Kim, 2013). Although many economists, economics teachers and politicians are apt to repeat this popular metaphor, Modern Monetary Theorists would claim that such a sentiment is simply untrue. According to them, current federal programs like the National School Lunch Program, Social Security, Medicare, and the Postal Service can actually be fully funded in ways that have little to nothing to do with tax revenues. Economist Stephanie Kelton (2020) argues that these funding issues are more political than they are financial or economic and derive from a mixture of ignorance about how money actually works and voter pressure.  

Modern Monetary Theory (MMT) “has achieved something quite rare for heterodox economics: it was in the headlines all over the world and in quick succession first denounced by all respectable policymakers, politicians and economists and then suddenly embraced as the necessary response to a global pandemic” (Wray, 2020, p. 3).  The Covid-19 pandemic has prompted discussions about issues that concern MMT; deficit spending, job guarantees, the availability of currency and the government’s role in aiding the public. These ideas “may be the economy’s only hope to get through the pandemic… a final test of MMT will come when the current pandemic ends, and the U.S. economy begins returning to normal” (Pressman, 2020, n.p.). Thus, it may be too late for the federal government to pursue any other course of action other than the deficit spending and other policies that MMT economists promote.

It has been said of Modern Monetary Theory that “once you get it you never see things quite the same way again (Kelton, 2020, p. 31). This is because MMT upends everything we think we know about how the economy works. In this article, I consider the contributions Modern Monetary Theory (MMT) can make to the fostering of the informed citizenry promoted by social studies education. MMT offers a new lens through which social studies educators and their students can view economics, politics and current events (Author, 2020). The goal of this article is not to convert or proselytize or to create MMT acolytes MMT, but to consider how MMT can prompt new and different ways to think about the economy. I highlight the way MMT can illuminate a current issue, the payroll tax deferral and the future of social security and other federally funded institutions.

Modern Monetary Theory: A Short Introduction

Modern Monetary Theory, a “once fringe idea” has suddenly “vaulted into the national conversation” (Bryan, 2019, n.p.). Although developed in the mid-1990s, Modern Monetary Theory, or MMT, gained a following when U.S. Representative Alexandria Ocasio-Cortez proposed it as a financial solution for the Green New Deal (Horsley, 2019 see also Seitz and Krutka, 2020).  In fact, although it is called a “theory” MMT “isn’t ‘theory’ at all” but “an accurate description of the monetary system that has already been operating in the United States and other sovereign nations with sovereign fiat currencies for decades” (Svetlik, 2019).In other words, MMT describes the system already in place and seeks to debunk myths about how money actually works. Thus, economists who promote MMT say that it is not an effort to change the financial system but to provide the public a more accurate picture of how it works.

Modern Monetary Theory was developed by University of Missouri-Kansas City economist Warren Mosler in the 1970s with the publication of the essay “Soft Currency Economics.” Bill Mitchell, who runs the Center of Full Employment and Equity at the University of Newcastle in New South Wales, Australia is credited with the term “Modern Monetary Theory.” Mosler and Mitchell’s ideas are drawn from the chartalism movement which originated in Germany in 1905. Chartalism means “ticket or token” “items that may be accepted as payment, but which do not have intrinsic value” (Hayes, 2021). This is an accurate description for modern United States currency. Since the United States went off of the gold standard in 1971, money is not backed by anything tangible and only functions because it is an agreed-upon currency backed by the sovereignty of the state.

Think like a currency issuer

You and I are currency-users. For that reason, we think like currency users. We have to access the national currency because we cannot print our own money. Unlike currency-issuers, we have to find ways to obtain the currency we need to buy the things we need and want and, most importantly, to pay taxes. Usually, this means we work to obtain the currency we need to participate in the economy. We also have to balance our budgets. This also means when we do not have enough money to pay for something we need or want, we must take out a loan and we must save money for things we want and need in the future. Budgeting, saving, borrowing and working in order to spend are very familiar concepts in K-12 economics education and comprise the crux of financial literacy. From a very early age, children are taught to make personal budgets, to make choices because they cannot have everything they want and to spend and save. The following quiz tests readers’ knowledge of everyday monetary “truths.”

Table 1. Monetary Policy Quiz

BeforeQuestion After
T/FThe purpose of taxes is to pay for government expendituresT/F
T/FSocial security, the United States Postal System and other federal programs can run out of moneyT/F
T/FGovernments introduce(d) currency as a way to make trade easier [than barter]T/F
T/FHouseholds, states and the Federal government must maintain    balanced budgets T/F
T/FTaxes must precede government spending (i.e. governments must collect money before they can spend it). T/F
T/FThat dollar in your pocket is yours T/F
T/FThe Federal government should reduce spending during recessionsT/F

Most people would answer true for most, if not all, of the questions. MMT, however, offers a different point of view, that of the currency-issuer.  Thinking like a currency-issuer means flipping everything we think we know about how the monetary system works, making all of the quiz answers false.

The issues with this curriculum have been noted (e.g. Sonu & Marri, 2018). However, some knowledge of how a person or household can manage their money may service currency-users fairly well, but it does little to help students develop into informed citizens who understand how their government makes decisions.  Kelton (2020) argues that this singular currency-user perspective is the key to Americans’ misinformation and to a continued state of needless austerity. One of these pervasive misunderstandings, and a “fundamental rule” taught to children, is that “money doesn’t grow on trees.” Thinking as a currency issuer is key to understanding both Modern Monetary Theory and U.S. monetary policy. This is because currency-issuers, play by entirely different rules than the currency-user rules taught in financial education. For example, using a currency-issuer’s point of view, MMT argues that the federal government can never actually run out of money despite “going broke” narratives thrown around by politicians. It cannot go bankrupt because “that would mean it ran out of dollars to pay creditors; but it can’t run out of dollars, because it is the only agency allowed to create dollars. It would be like a bowling alley running out of points to give players” (Matthews, 2019). This is a fact corroborated by Alan Greenspan in 2005 testimony before Congress regarding social security “there’s nothing to prevent the federal government from creating as much money as it wants and paying it to somebody” (Kelton, 2020, p. 256).

Taxes

In the United States, any talk of taxes is going to spark heated debate and strong feelings. Tax policies are at the center of any politician’s platform and the “taxpayer…is at the center of the monetary universe because of the belief that the government has no money of its own” and therefore needs ours (Kelton, 2020, p. 2). Taxes and taxpayers are indeed at the center of the monetary universe, but not for the reasons we may think.

The federal government doesn’t actually need to take our money from us, physically. Warren Mosler (2010) put it this way:

What happens if you were to go to your local IRS office to pay your taxes with actual cash? First, you would hand over your pile of currency to the person on duty as payment. Next, he’d count it, give you a receipt and, hopefully, a thank you for helping to pay for social security, interest on the national debt, and the Iraq war. Then, after you, the tax payer, left the room, he’d take that hard-earned cash you just forked over and throw it in a shredder. Yes, it gets thrown it away. Destroyed! Why? There’s no further use for it. Just like a ticket to the Super Bowl. After you enter the stadium and hand the attendant a ticket that was worth maybe $1000, he tears it up and discards it.

The story above demonstrates how the federal government doesn’t actually take in “our” tax money because we pay our taxes in the dollars that it prints. It is simply a matter of pluses and minuses on a spreadsheet. MMT stresses that the government doesn’t need our money, we need its money. 

However, this does not mean that taxes do not matter. In MMT, taxes play more of a social, rather than revenue-raising role. Ideally, taxation should serve not necessarily as a redistribution of wealth but as a tempering mechanism that curbs outsized wealth accumulation. Thought about this way, tax paying is more of a civic duty for the health of the economy rather than as something to avoid or that is “taken.” Taxes, then, are part of a socio-economic contract that has to do with, among other things, creating feelings of entitlement-creating a demand for government and gov’t spending as well as tending to the health of the economy by curbing inflation and, ideally, rebalancing distribution of wealth and income (Kelton, 2020, p. 71).

The main thing, though, is that taxes create a demand for currency.  This notion is based on money usage in ancient Egypt and Greece. These origins are evidence that taxation and social relations, not a replacement for barter, was the real origin of money. In Egypt, the deben (value of goods and labor services) was paid as a tax to fund the public and public works. Bookkeeping was developed as a way to keep track of these debts and obligations (Semenova & Wray, 2015). Basically, the theory is that people must find a way to earn currency in order to pay their taxes. The government, in turn, gets a population that is employed and engaged in public works but that is also reliant upon the government for currency. This is just like a token economy in classrooms. A teacher introduces a currency, offers tangibles to create demand and outlines a way to obtain it. The teacher does this not because she needs pieces of paper to return to her (they are worthless) but because she needs their compliance and their work.

Creating a supply and demand for currency is a classic colonizing tactic; “currency-issuing colonial governments did not need tax payments for revenue but imposed them to force Natives into the wage relation; tax-driven money was a colonial governance mechanism that enabled the mobilization [of currency]” (Feinig, 2020, p. 2).  Although the Tea and Stamp Acts are well-known in American history, the Currency Act of 1764 is not. The Currency Act is essential to understanding the more famous tax acts. A colonizing strategy is for the colonizing nation to impose taxes for the same reason all governments impose taxes-to create a demand for currency. The Currency Act banned the colonies’ practice of printing their own paper money. The tax not only helped Britain locate offenders, but forced Americans to pay their debts to British merchants and to the Crown in pound sterling (see Murphy, 2017 and Office of the Historian, n.d.). Thus, the issue was perhaps not so much the taxes as the currency with which those taxes were to be paid.

 Teachers can lead students in a reconsideration of the role of currency in the colonies and investigate current-day iterations. For example, students can investigate the current anti-CFA movement (see Konkobo, 2017). The CFA Franc, established by France for its colonies and now tied to the Euro, is used by fourteen African nations. Proponents say it stabilizes the nations’ currencies. Opponents say it robs these nations of say over monetary decisions and funnels more money to Europe than received in aid.

Payroll Taxes and Social Security

On August 8, President Trump signed an Executive Order, Deferring Payroll Tax Obligations in Light of the Ongoing COVID-19 Disaster, which deferred the employee portion of Social Security payroll taxes for certain individual. To many Americans, this measure seemed strange and unnecessary. For one, it only deferred, not forgave, payroll taxes. Second, it only “helped” those who pay payroll taxes. Third, the amount of money seemed insignificant, especially when Americans were expecting relief checks, not tax breaks.

With this measure, though, President Trump introduced a tactic to defund social security. However, without knowing the history of social security, this agenda would not be obvious. No President, especially one up for re-election and courting the elderly vote, would threaten social security outright. After all, the program was designed to be defund-proof, as Franklin Roosevelt famously stated, “no damn politician can ever scrap my social security program.” This is because FDR designed a funding scheme built upon a little psychological trick that played on the public’s currency-issuer mindset.

Seeing is believing [that you earned it]

In response to the payroll tax deferral, House Ways and Means Social Security Subcommittee Chairman John B. Larson acknowledged this defunding scheme in his “Save our Social Security Now” hearing on September 24, 2020, stating “and so, when some on the other side of the aisle talk about ‘terminating’ Social Security’s payroll contributions, they are threatening the very existence of this bedrock program.” What does a payroll tax deferral have to do with dismantling social security? The answer has to do with the power of perception.

            Today, 59 million Americans receive retirement, disability and/or survivors’ benefits. Social Security was signed into being by Franklin Roosevelt in 1935 as a measure to alleviate poverty. The history of social security and the debates surrounding it are demonstrated in this EconEdLink lesson, which can be a useful supplement to this inquiry.

FDR knew that the federal government could fund social security. This has since been corroborated by Alan Greenspan (see Norman, 2016).  Instead, he needed to ensure the public demanded this funding (supply and demand). FDR knew the power of perception. Even though the federal government could fund social security without personal contributions, a payroll tax ensures workers see their contributions to social security leave their checks each pay period; “We put those payroll contributions there so as to give the contributors a legal, moral, and political right to collect their pensions and their unemployment benefits. With those taxes in there, no damn politician can ever scrap my social security program.” Basically, FDR wanted to foster a sense of entitlement among workers who paid into the system in order to destroy what he saw as a “relief attitude” or the working person’s resistance to accepting charity. Those who felt they earned their social security payments would not only demand those payments but would hold politicians to ensuring their continuation.

Politics all the way through

“Entitlement” has undergone a transformation in connotation since the Reagan administration. In FDR’s time, the term was “earned entitlement.” “Earned” was then dropped, and, with it, the reminder that social security is something owed to people because they meet the qualifications for receiving it, to be able to live a dignified life in old age and because it is owed to them for not only what they paid in but also for working.

FDR’s “trick” is expressed in a 1941 memorandum from Luther Gulick. In the memo, Gulick proposes the institution of a sales tax as opposed to the payroll tax. In the memo’s last paragraph, Gulick stated “I raised the question of the ultimate abandonment [of] the pay roll taxes in connections with old age security and unemployment relief in the event of another period of depression.” This is a notable parallel to the economic situation in 2020. To this proposal, FDR is reported to have responded that the economics “are politics all the way through.”

To begin the lesson, teachers can have students examine a paycheck stub, asking them to notice the various taxes paid by the worker. Today, with the popularity of direct deposit options, workers may pay less attention to these numbers than in the past. Teachers and students should discuss the psychological effect of these taxes. Likely strong feelings will be elicited. Teachers can use this emotion as an example of “earned entitlement.” Although “entitlement” is often used pejoratively today, it was originally meant to signify someone’s right to collect on what has been promised, or owed, to them. Then, teachers can introduce Social Security, guiding students through the final paragraph of the Gulick letter. Students can consider whether or not FDR’s decision to “fund” social security through payroll tax made the program successful. Finally, discuss the September 2020 CARES Act, specifically the intricacies of the payroll tax deferral. Students can compare the stated aims of this measure, which in reality would make little substantial difference to the average worker to its longer-term effects. Students can analyze H.R. 8171, the “Save our Social Security Now” Act. The document outlines 17 “findings” related to the efficacy and purpose of social security. The final three, numbers 15-17, specifically cite the deferment of payroll taxes as “the first step in his announced plan to entirely defund Social Security by eliminating payroll contributions altogether beginning in 2021.” Primary sources related to Social Security can be found at http://www.sa.gov/history. Students can conclude the lesson by considering whether or not FDR’s “funding” scheme was a mistake, in that “entitlements have fared especially badly…partly because of early decisions that were intended to protect them” (Kelton, 2002, p. 158).

Conclusion: What to do in times of economic downturn?

Once we realize that the federal government’s role is to provide currency not-collect to it, our whole perspective changes. For example, it reminds us that federal institutions like the U.S. Postal Service and Social Security aren’t intended to be profit-generating, but to serve the public. MMT, and the currency-issuer’s perspective help us consider the Federal government’s responsibility to its people, especially in times of economic downturn. Proponents of MMT suggest that “since the government imposes the tax that causes people to look for wages to earn currency, the government should make sure there is always a way to earn currency” (Kelton, p. 65). Currency comes from the Federal government, therefore it is the Federal government’s job to ensure people have a way to obtain it. As Kelton further argues, without a jobs guarantee, minimum wage is not actually $7.25/hour but $0.

The ability to see through these initiatives and to critically read economic policy is a crucial component of economic literacy (Author, 2021). MMT, and the perspectives it fosters, help develop citizens’ ability to understand the political agendas being enacted through economic and monetary policies by taking a currency-issuer’s perspective. The United States doesn’t need our money, we need its. We, in turn, provision the government through circulating currency and engaging in public works. MMT reminds us that we are entitled, and that entitled is not a bad word.

References

Bryan, B. (13, March 2019). A new survey shows that zero top U.S. economists agreed with the basic principles of an economic theory supported by Alexandria Ocasio Cortez. Business Insider. Retrieved from https://www.businessinsider.com/economist-survey-alexandria-ocasio-cortez-modern-monetary-theory-2019-3

Feinig, J. (2020). Toward a moral economy of money? Money as a creature of democracy. Journal of Cultural Economy. Retrieved from https://doi.org/10.1080/17530350.2020.1729223

Greenspan, A. (2005). Testimony: Future of the Social Security program and economics of retirement. Retrieved from https://www.federalreserve.gov/boarddocs/testimony/2005/20050315/default.htm

Hayes, A. Chartalism. Investopedia. Retrieved from https://www.investopedia.com/terms/c/chartalism.asp

Horsley, S. (2019). This economic theory could be used to pay for the Green New Deal.” NPR Morning Edition. Retrieved from https://www.npr.org/2019/07/17/742255158/this-economic-theory-could-be-used-to-pay-for-the-green-new-deal.

Kelton, S. (2020). The deficit myth: Modern Monetary Theory and the birth of the people’s economy. PublicAffairs

Kim, C. (19, December 2013). Poor kids should sweep the floors for school lunches, says GOP Rep. MSNBC. Retrieved from https://www.msnbc.com/the-last-word/gop-rep-poor-kids-should-sweep-school-floors-msna234371

Konkobo, L. (2017). African protests over the CFA ‘colonial currency’. BBC. Retrieved from https://www.bbc.com/news/world-africa-41094094

Larson, J.B. (2020). HR 8171. Retrieved from https://www.congress.gov/bill/116th-congress/house-bill/8171/text

Matthews, D. (16, April 2019). Modern Monetary Theory, explained. Vox. Retrieved from https://www.vox.com/future-perfect/2019/4/16/18251646/modern-monetary-theory-new-moment-explained

McCloskey, D. N. (1983). The rhetoric of economics. Journal of Economic Literature, 21(2), 481-517.

Mosler, W. (2010). Seven deadly innocent frauds of economic policy. Valance Co., Inc. Retrieved from http://moslereconomics.com/wp-content/powerpoints/7DIF.pdf

Mosler, W. (2018). Soft currency economics. Retrieved from http://moslereconomics.com/wp-content/uploads/2018/04/Soft-Curency-Economics-paper.pdf

Murphy, S.A. (2017). Early American colonists had a cash problem. Here’s how they solved it. Time. Retrieved from https://time.com/4675303/money-colonial-america-currency-history/

Norman, M. (20, July 2016). Social Security: If it ain’t broke…and it ain’t, and it never will be. Real Money. Retrieved from https://realmoney.thestreet.com/articles/07/20/2016/social-security-if-it-aint-broke-…-and-it-aint-and-it-never-will-be

Office of the Historian. Parliamentary taxation of colonies, international trade, and the American Revolution 1763-1775. Retrieved from https://history.state.gov/milestones/1750-1775/parliamentary-taxation

Pressman, S. (11, August 2020). Trillions in Coronavirus spending is putting AOC’s favorite economic theory to the test. The Conversation. Retrieved from https://theconversation.com/trillions-in-coronavirus-spending-is-putting-aocs-favorite-economic-theory-to-the-test-143378

Seitz, Z & Krutka, D.G. (2020). Can the Green New Deal save us? An interdisciplinary inquiry. The Social Studies, 111(2), 74-85.

Semenova, A. & Wray, L.R. (2015). The rise of money and class society: The contributions of John F. Henry. Working Paper No. 832. Levy Economics Institute. Retrieved from http://www.levyinstitute.org/pubs/wp_832.pdf

Sonu, D. & Marri, A. (2018). The hidden curriculum in financial literacy: Economics, standards and the teaching of young children. In T.A. Lucey and K.S. Cooter (Eds.) Financial literacy for children and youth. Peter Lang. 2nd ed.

Svetlik, D. (31, March 2019). Modern Monetary Theory Unit 1: Money and physical resources. MiddleWisconsin.org. Retrieved from http://www.middlewisconsin.org/modern-monetary-theory-unit-i-money-and-physical-resources/

Wray, L.R. (2020). The ‘Kansas City’ approach to Modern Monetary Theory. Working Paper No. 961. Levy Economics Institute. Retrieved from http://www.levyinstitute.org/pubs/wp_961.pdf