The Devastating Effects of the Great Leap Forward

Right after the end of the Second World War, there was a new issue that took center stage that would essentially divide the entire world in half for the next several decades, that being the rise and spread of communism. Initially starting during the Russian Revolution in 1917, communism was starting to spread throughout the world due to the expanding influences of socialist ideologies that were turning many civilizations into communist states either under or at the very least inspired by the Soviet Union. Many other countries began seeing their own revolutions that would lead to a rebirth or major change within their government system, with one such example being China becoming a communist nation in 1949. The man who single handedly led the people of China into a new era in Chinese history and would become their new leader was Mao Zedong. During this time in the world, the cold war was in full effect with many countries not only falling to communism, but also the race to advance a nation’s status among the world. Mao Zedong saw that China had the full potential to grow stronger and faster in their economy, resources, and military. Starting in 1958, Mao Zedong would launch the Great Leap Forward, a movement that would focus on improving China’s stature as fast as possible to catch up with other global powers such as the Soviet Union and the United States. However, Mao’s ambitious methods and dedication to rapidly increasing production and change in China would majorly backfire. It isn’t a disputed claim that the Great Leap Forward did not work and was in fact a major failure under Mao Zedong’s leadership, but how bad were the repercussions from the Great Leap Forward? This paper will be discussing the extent of the failures and cost of human lives caused by the Great Leap Forward.

            The early stages of the Cold War consisted of the biggest, most powerful nations during that time displaying their strength, alliances, power, and influence over the world. One side of the conflict was the United States, which had significant military strength, government leadership, and made it their goal to get involved when necessary to prevent other countries from falling to communism. On the other side of the spectrum was the Soviet Union, who held control over nearly half of Europe (particularly the nations who were formerly occupied by the Axis powers during World War II), and was starting to spread their influences throughout several parts of Asia, including China. The leader of the newly founded People’s Republic of China, Mao Zedong, took notice of how fast the Soviet Union was able to rapidly catch up to the world, and that it was one of the biggest reasons towards what led the U.S.S.R. to be seen as major and powerful threats towards the rest of the world.

In the article Demographic Consequences of the Great Leap Forward in China’s Provinces by Xizhe Peng, Mao’s ambition to replicate what was done just earlier under Stalin’s five year plans is what would inspire his decision to speed up production throughout the country’s systems in order to quickly reach the level of and even outperform other countries1. “the late Chairman Mao Zedong proposed the goal for China of overtaking Great Britain in industrial production within 15 years…The general line of the Party that guided the Great Leap Forward was ‘Going all out, aiming high and achieving greater, faster, better, and more economical results in building socialism’” (Peng)1. Beginning in 1958, China wanted to reach certain levels of production in which Mao Zedong would see as great improvements for China in building strength within resources, such as industrializing faster in order to catch up on steel production in order to provide more tools, resources, and military equipment. Nearly all citizens would be put to work in order to help contribute towards the bigger collection, and while in practice this may seem like a good idea, there would only be problems that quickly emerged which eventually lead bad situations to catastrophic failures. 

            Poor decisions, bad thought processes, and poor actions that were made by Chairman Mao Zedong would heavily damage his own society and would be the somewhat direct cause of the deaths of millions of people. In the article Dealing with Responsibility for the Great Leap Famine in the People’s Republic of China by Felix Wemheuer, it discusses about who or what the Chinese communist party blamed for the disastrous results that the Great Leap Forward caused in the rise of famine and deaths throughout China, and many felt that Mao Zedong himself was solely responsible.2 For a short while, Mao Zedong was so stubborn that he refused to accept responsibility for what he caused to happen throughout China, instead wanting to blame other elements. However, due to pressure from his party and the massive amount of devastation that was now throughout China due to the failure of wanting to mass produce, Mao Zedong would eventually take some of the blame.

            The rapid growth that the Soviet Union was able to accomplish in just a short amount of time was a remarkable feat. The Soviet Union succeeded in becoming the industrial powerhouse that they were in the mid-20th century, and it was an impressive achievement for showing how any country can shift their goals and, within a short time period, can grow in the eyes of the world in terms of strength and power. In the period of world history where many countries were racing in the growth of their industry, military, and their level of dominance in the world, Mao Zedong was looking to use, explore, and expand upon similar strategies in order for China to join the arms race and to be seen as a powerful contender. Mao Zedong was clearly trying to follow in their footsteps in rapidly increasing their resources and financial stock, but just as how the Russians suffered through major push-back, the people of China would face similar, yet even greater push-back towards their economy. The article Causes, Consequences and Impact of the Great Leap Forward in China by Hsiung-Shen Jung and Jui-Lung Chen describes the detrimental damage the Great Leap Forward caused to China’s economy3. “After the Great Leap Forward, it took five years to adjust the national economy before it was restored to the 1957 level… economic losses of up to RMB 120 billion” (Hsiung-Shen and Jui-Lung)3. The nation was put under tremendous debt due to the poor planning and even worse results caused by Mao Zedong during the period of the Great Leap Forward, and to top it off, Mao’s stubbornness prevented him from taking any responsibility. Mao would even go on to make claims to purposely lead the people of China’s frustrations towards something else. It is stated within Hsiung-Shen Jung and Jui-Lung Chen’s article that “Mao remained reluctant to fully acknowledge the mistakes of the Great Leap Forward… he proposed the Party’s fundamental approach in the socialist stage, followed by a left-wing socialist educational campaign aimed at cracking down on the capitalist roaders,” (Hsiung-Shen and Jui-Lung)3. Just as Mao spread his ideologies and political messages throughout China to the people, he responded to the major hardship of a failed experiment he caused by trying to shift the blame onto those with the opposite economic and business philosophies of the Chinese Communist Party. The main cause of the detrimental shape of China’s economy due to major loss in food production, labor, and the loss of people’s lives was caused pushing the country too hard and too fast in Mao’s egotistical push for China to change and grow faster rather than taking his time for proper developmental growth and a fair distribution of the wealth, food, and supplies to his own citizens.

            The famine caused by the Great Leap Forward is one of just a few of the most infamous famines throughout history, such as the notorious Irish potato famine of the 19th century that killed over a million people. The total death toll of the famine caused in China during the Great Leap Forward was in the tens of millions, and as the article Mortality consequences of the 1959-1961 Great Leap Forward famine in China: Debilitation, selection, and mortality crossovers by Shige Song describes famines, “Famine is a catastrophic event” (Song)4.

This same article goes into a research study done by the author who has not only compromised data from the mortality rate and statistics during the Chinese famine, but also how it had such negative repercussions for the people and birth rates afterwards, such as a graph that shows the probability of survival decreasing4. The declining rate of survival not only affected very young kids and teens, but was affecting people years after the famine was over. The distribution of food supplies and decreasing amount of crops successfully growing made such a major dent in the health and lifespan of the average citizen in China, and that the famine itself began so quickly and rapidly within a short period of time. The Great Leap Forward only lasted for a few years, but its severe damages caused upon China would cause the people of China to continue to suffer for the following years to come.

            When thinking about how to measure the severity of an event or period of time, one may look at the total number of people that died who were directly linked to the occurrence. While this is certainly a fully reasonable statistic to use, in the case of a famine where the main cause of death is starvation, it can create the question of how much of a difference in food output really was there? The article The Great Leap Forward: Anatomy of a Central Planning Disaster by Wei Li and Dennis Tao Yang goes into many exact pieces of data and statistics regarding the output of grain being grown, the number of workers, and other elements of farm production5.

The Great Leap Forward lasted from 1958-1962, and within Li and Tao Yang’s grain output table in China, it shows that the total grain output during the years of the Great Leap Forward decreased by almost 100 million tons of grain, which is a loss of almost half of the total grain output just before the Great Leap Forward5. During this same time range, there was a noticeable decrease in workers, presumably dying due to the famine and harsh labor they were being put through. However, there was also an increase in both farm machinery and chemical fertilizer which would rapidly increase more in the years after the Great Leap Forward. Now while this can be considered a small victory for Mao’s intent on rapidly increasing and modernizing China’s agriculture, it did come at the major cost of both a famine, a decrease in crops being grown, and the loss of many Chinese farmers. The advanced farming tools, machinery, and techniques that did come from the Great Leap Forward still came at a major cost for the people and economy of China.

            While farming and grain production was a very big part in the overall progression of China’s resources, it wasn’t the only thing that Mao Zedong was trying to rapidly change and try to improve in order to make China a more powerful country. For most of history, China was primarily an agricultural society, but in the turn of the 20th century, many countries were beginning to not only industrialize in materials, resources, and military, but they were doing so at a very fast rate. The production of steel in China was to be taken much more seriously in order for China to catch up with the other world powers in terms of strength in industrialized resources, but just like with the negative consequences of rapidly changing grain production, Mao’s attempt to reform steel production in China also came with its own tolls. Going back to Wei Li and Dennis Tao Yang’s article The Great Leap Forward: Anatomy of a Central Planning Disaster, there is a statistics table done on the steel production and output in China during this time period, and it shows how big of a jump there was in steel and iron output within a very short amount of time5. China was able to triple their steel and iron output during the years of the Great Leap Forward, and the number of production units increased from tens of households to over two thousand households in just a few years5. However, during this same time gap, the number of provinces that allowed its people to have exit rights quickly went down as more and more provinces were quickly taking away rights from its own workers. Also, in the years after the Great Leap Forward, the output of steel and the number of production units would decrease by a noticeable amount, showing that it was only just a very short term benefit with major consequences5. This shows how quick, rapid, and big changes in the production of any resource within a country is not good for the other elements of that country, such as human rights and households with either food or enough materials and resources.

            The rapid increase in the demand for more food and a faster input of the growth of crops was not good in the long run for the people themselves, since it would cause a famine and leave millions upon millions of people to starve to death. Starvation is already a major issue for the population of one of the most populous countries in the world, but not only were the Chinese people affected negatively by the Great Leap Forward’s farming strategies, but the ground itself was severely damaged by the rapid changes and increased activity in China. The article Terrain Ruggedness and Limits of Political Repression: Evidence from China’s Great Leap Forward and Famine (1959–61) by Elizabeth Gooch explains how Mao’s farming campaign during the Great Leap Forward not only increased the mortality rate, but also damaged the dirt and soil of China6. There are statistics and graphs put together by Elizbeth Gooch in her article showing how because of the Great Leap Forward, there was an increased number in the amount of rugged terrain due to a vast increase of production, manufacturing and pollution that were caused by the Great Leap Forward6. A lot of the natural dirt, soil, and nutrients found within the farming grounds used for growing crops, plants, and foods were now blighted by the overproduction going on throughout China, and that there are even parallels between the death rate and the rate of soil becoming rugged. Mao Zedong wanted grain production, along with the production of other resources, to keep increasing, but due to his plans being executed in poor fashion and horrendous results, he was causing so much harm and damage towards the people of China and to China’s natural environment.

The number of crops being harvested is down, the natural land of China is dwindling, and there is a famine that has taken the lives of millions of people, but there’s a chance that this was all worth it in the long run for the growth and prosperity of China. The main purpose of Mao Zedong’s Great Leap Forward was for China to catch up with the other fully developed and powerful countries, and one of the biggest factors that can help with that is having an efficient, well running, and strong industrial production system. Ever since the Industrial Revolution began back in the 19th century, civilizations one by one have moved forward with their main economic resource production with the building of many factories that produced metal, steel, and other materials. This was also one of the biggest things to come out of the Soviet Union’s rapid growth in power in the early 20th century, and it was the strong industrial powerhouse that Joseph Stalin achieved for his country that Mao Zedong wanted to implement for China. Returning to Elizabeth Gooch’s Terrain Ruggedness and Limits of Political Repression: Evidence from China’s Great Leap Forward and Famine (1959–61), the growth of industrialization within China was perhaps one of the biggest accomplishments in the Great Leap Forward6. As the line graphs in Gooch’s article shows, industry increased by a very large amount during the years of the Great Leap Forward, although agriculture took a slight decrease during that same time frame, most likely due to many of the farmers being forced to work in the newly made factories and steel producing areas6. However, while looking at the rates of birth, growth, and death during these same few years, it becomes clear that the success of rapid Chinese industrialization came at the expense of the people themselves. The birth and growth rate took a big decrease during this time, and the rate of death tremendously increased6. While China did greatly benefit from the growth of industry and metal production, it was done at the cost of the health and safety of the people, along with attention being shifted away from agriculture and polluting the land.

Besides the main elements of the Great Leap Forward that were seen as major problems for the people of China, such as grain, steel, food, and other resources, there was also another very important element that is crucial for the survival of people and civilizations: water. In the Great Leap Forward, there were also campaigns for the industrial working, usage, and processing of water that in itself would cause even more issues for China. In the article The Great Leap Forward (1958-1961) Historical events and causes of one of the biggest tragedies in People’s Republic of China’s history by Adriana Palese, it describes the effects of the increase of water conservation projects from 25 million to 100 million, “inhuman working hours”, and that the the projects themselves weren’t a success with a cost at the expense of the people of China, as “most were useless and caused disasters some years after and other projects were simply abandoned and left uncompleted” (Palese)7. While there is mention of a decrease in flooding, this is once again an example of the many campaigns launched by Mao Zedong to improve and advance China with rapid industrialization, it did not at all work for the benefit of the people of China as a whole since the vast majority of people would suffer from this, along with the other failed campaigns during the Great Leap Forward.

While rapidly increasing the production of everything in China may be seen as good in concept, not only would it very negatively harm the people and the society of China, but sometimes these bold campaigns would actually make these situations worse than they were before. In Adriana Palese’s The Great Leap Forward (1958-1961) Historical events and causes of one of the biggest tragedies in People’s Republic of China’s history, she writes that “there were total shortages of other foods and other products such as cooking oil, sugar, thermos bottles, porcelain dishes, glasses, shoes, etc” (Palese)7. Not only could less food be made due to the dwindling number of crops being grown and an ongoing famine, but the manufactured goods of simple tools and supplies were faxing a big shortage and that it seems like the simple transactional market based economy of China for all goods and products was collapsing. Palese’s article even includes the wide percentage decrease in the output of agriculture and industrial goods that were happening during this time period7. The Great Leap Forward was rapidly deteriorating all elements that make up Chinese society, their economy, public morale, and way of life.

During one of the most crucial parts of the Great Leap Forward, Mao Zedong aimed to improve and increase the farming of grain since it was still seen as a very important part in actually feeding the population. However, a common enemy to the growth of any crops in a farming society is bugs, pests, and other insects since they can eat away at the growing crops. Mao Zedong had his own solution to this problem. In the article China’s deadly science lesson: How an ill-conceived campaign against sparrows contributed to one of the worst famines in history by Jemimah Steinfeld, “As part of the Four Pests campaign – a hygiene campaign against flies, mosquitoes, rats and sparrows – people were called upon to shoot sparrows, destroy their nests and bang pots and pans until the birds died of exhaustion” (Steinfeld)8. Anyone in China, men, women, and children were able to participate in the killing/removal of these target pests. While there were minor victories removing these pests, it overall came at a serious cost. One of these so called pests, the sparrows, were removed from the China’s agricultural society, but they were responsible for keep an even bigger threat towards crops away, locusts.8 Even after Mao Zedong had stop the killing of sparrows, the damage has already been dead, as this was one of the biggest reasons in what led to the famine spreading so rapidly and quickly through China, causing the deaths of millions of people in just a few short years.8 This was seen as why no matter the circumstances or beliefs, the ecosystem of any land should never be altered or drastically changed for the human need, since removing living creatures from their natural habitat and cycle would cause such a direct correlation between the farming/pest campaign to the millions of deaths caused by famine.

In conclusion, while the Great Leap Forward was initially seen as a progressive strategy to quickly advance Chinese society, it ultimately resulted in failure. Millions of people would die due to starvation caused by mass famines throughout the vast farmland of China. Many farmers were taken from their fields and forced to work in industrial yards in order to catch up on steel and metal resources for China. Mao Zedong was so blinded by the result of other nation’s rapid industrialization that he ignored what negative consequences can come of it, only this time China would suffer greater than any country has suffered before with little to nothing to show for it. Mao Zedong’s attempt in advancing China only set back the country, reduced morale and reduced support from his own party. The Great Leap Forward will go down in history as one of the most devastating eras in Chinese history due to the major count of the loss of life and how one of the oldest and culture rich societies in the world nearly destroyed themselves over ambitious goals due to the global affairs in the Cold War.

Endnotes

  1. Peng, Xizhe. “Demographic Consequences of the Great Leap Forward in China’s Provinces.” The China Quarterly 159 (1999): 430-453.
  2. Wemheuer, Felix. “Dealing with Responsibility for the Great Leap Famine in the People’s Republic of China.” The China Quarterly 216 (2013): 402-423.
  3. Jung, Hsiung-Shen, and Jui-Lung Chen. “Causes, Consequences and Impact of the Great Leap Forward in China.” Asian Culture and History 11, no. 2 (2019): 61–70.
  4. Song, Shige. “Mortality Consequences of the 1959–1961 Great Leap Forward Famine in China: Debilitation, Selection, and Mortality Crossovers.” Social Science & Medicine 71, no. 3 (2010): 551–558.
  5. Li, Wei, and Dennis Tao Yang. “The Great Leap Forward: Anatomy of a Central Planning Disaster.” Journal of Political Economy 113, no. 4 (2005): 840–77.
  6. Gooch, Elizabeth. “Terrain Ruggedness and Limits of Political Repression: Evidence from China’s Great Leap Forward and Famine (1959–61).” Journal of Comparative Economics 47, no. 4 (2019): 699–718.
  7. Palese, Adriana. The Great Leap Forward (1958–1961): Historical Events and Causes of One of the Biggest Tragedies in People’s Republic of China’s History. Bachelor’s thesis, Lund University, 2009.
  8. Steinfeld, Jemimah. “China’s Deadly Science Lesson: How an Ill-Conceived Campaign Against Sparrows Contributed to One of the Worst Famines in History.” Index on Censorship 47, no. 3 (September 2018): 6–8.

Jung, Hsiung-Shen, and Jui-Lung Chen. “Causes, Consequences and Impact of the Great Leap Forward in China.” Asian Culture and History 11, no. 2 (2019): 61–70.

Gooch, Elizabeth. “Terrain Ruggedness and Limits of Political Repression: Evidence from China’s Great Leap Forward and Famine (1959–61).” Journal of Comparative Economics 47, no. 4 (2019): 699–718.

Li, Wei, and Dennis Tao Yang. “The Great Leap Forward: Anatomy of a Central Planning Disaster.” Journal of Political Economy 113, no. 4 (2005): 840–77.

Palese, Adriana. The Great Leap Forward (1958–1961): Historical Events and Causes of One of the Biggest Tragedies in People’s Republic of China’s History. Bachelor’s thesis, Lund University, 2009.

Peng, Xizhe. “Demographic Consequences of the Great Leap Forward in China’s Provinces.” The China Quarterly 159 (1999): 430-453.

Song, Shige. “Mortality Consequences of the 1959–1961 Great Leap Forward Famine in China: Debilitation, Selection, and Mortality Crossovers.” Social Science & Medicine 71, no. 3 (2010): 551–558.

Steinfeld, Jemimah. “China’s Deadly Science Lesson: How an Ill-Conceived Campaign Against Sparrows Contributed to One of the Worst Famines in History.” Index on Censorship 47, no. 3 (September 2018): 6–8.

Wemheuer, Felix. “Dealing with Responsibility for the Great Leap Famine in the People’s Republic of China.” The China Quarterly 216 (2013): 402-423.

Unseen Fences: How Chicago Built Barriers Inside its Schools

Northern public schools are rarely ever centered in national narratives of segregation. Yet as Thomas Sugrue observes, “even in the absence of officially separate schools, northern public schools were nearly as segregated as those in the south.”[1] Chicago Illustrates this, despite the Jim Crow laws, the city developed a racially organized educational system that produced outcome identical to those segregated in southern districts.  The city’s officials celebrated equality while focusing on practices that isolated black students in overcrowded schools. The north was legally desegregated and was not pervasive but put into policies and structures of urban governance.

This paper argues that Chicago school segregation was intentional. It resulted from a coordinated system that connected housing discrimination, political resistance to integration, and targeted policies crafted to preserve racial separation in public schools. While Brown v. Board of Education outlawed segregation by law, Chicago political leaders, school administration, and networks maintained it through zoning, redlining, and administrative manipulation. Using both primary source, newspapers NAACP records, and a great use of historical scholarship, this paper shows how segregation in Chicago was enforced, defended, challenged, and exposed by the communities that it harmed.

The historical context outlined above leads to several central research questions that guide this paper. First, how did local governments and school boards respond to the Brown v. Board of Education decision, and how did their policies influence the persistence of segregation in Chicago? Second, how did housing patterns and redlining contribute to the continued segregation of schools? Third, how did the racial dynamics of Chicago compare to those in other northern cities during the same period?

These questions have been explored by a range of scholars. Thomas Surgue’s Sweet Land of Liberty provides the framework for understanding northern segregation as a system put in the local government rather than state law. Sugrue argues that racism in the north was “structural, institutional, and spatial rather than legal, shaped through housing markets, zoning decisions, and administrative policy. His work shows that northern cities constructed segregation through networks of bureaucratic authority that were hard to challenge. Sugrue’s analysis supports the papers argument by demonstrating that segregation in Chicago was not accidental but maintained through everyday decisions.

Philip T.K. Daniel’s scholarship deepens this analysis of Chicago by showing how school officials resisted desegregation both before and after Brown v. Board. In his work A History of the Segregation-Discrimination Dilemma: The Chicago Experience, Daniel shows that Chicago public school leaders manipulated attendance boundaries, ignored overcrowding schools, and defended “neighborhood schools” as the way to preserve racial separation. Daniel highlights that “in the years since 1954 Brown v. Board of Education decision, research have repeatedly noted that all black schools are regarded inferior.”[2] Underscoring the continuing of inequality despite federal mandates. Daniel’s findings reinforce these papers claim that Chicago’s system was made intentional, and the local officials played a high role in maintaining segregation.

Dionne Danns offers a different perspective by examining how students, parents, and community activists responded to the Chicago public school’s discriminatory practices. In Crossing Segregated Boundaries, her study of Chicago’s High School Students Movement, Danns argues that local activism was essential to expose segregation that officials tied to hide. She shows that black youth did not just fix inequalities of their schools but also developed campaigns, boycotts, sit-ins, which challenged Chicago Public School officials and reshaped the politics of education. Danns’ work supports the middle portion of this paper, it analyzes how community resistance forced Chicago’s segregation practices in a public view.

Paul Dimond’s Beyond Busing highlights how the court system struggled to confront segregation in northern cities because it did not connect with the law. Dimond argues that Chicago officials used zoning, optional areas, intact busing, and boundaries to maintain separation while avoiding the law. He highlights that, “the constant thread in the boards school operation was segregation, not neighborhood,”[3] showing that geographic justification was often a barrier for racial intent. Dimond’s analysis strengthens the argument that Chicago’s system was coordinated and on purpose, built through “normal” administrative decisions.

Jim Carl expands the scholarship into the time of Harold Washington, showing how political leadership shaped the educational reform. Carl argues that Washington believed in improving black schools not through desegregation but through resource equity and economic opportunities for black students. This perspective highlights how entrenched the early segregation policies were, reformers like Washington built a system that was made to disadvantage black communities. While Carl’s focus is later in the Papers period, his work provides the importance of how political structure preserved segregation for decades.

Chicago’s experience with segregation was both typical and different among the northern cities. Cities like Detroit, Philadelphia, and New York faced similar challenges. Chicago’s political machine created these challenges. As Danns explains in “Northern Desegregation: A Tale of Two Cities”, “Chicago was the earliest northern city to face Title VI complaint. Handling the complaint, and the political fallout that followed, left the HEW in a precarious situation. The Chicago debacle both showed HEW enforcement in the North and West and the HEW investigating smaller northern districts.”[4]  This shows how much political interest molded the cities’ approach to desegregation, and how federal authorities had a hard time holding the local systems responsible. The issue between the local power and federal power highlighted a broader national struggle for civil rights in the north, and a reminder that racial inequality was not only in one region but in the entire country. Chicago’s challenge highlights the issues of producing desegregation in areas where segregation was less by the law, and more by policies and politics.

Local policy and zoning decisions made segregation rise even more. In Beyond Busing, Paul R. Dimond says, “To relieve overcrowding in a recently annexed area with a racially mixed school to the northeast, the Board first built a school in a white part and then rejected the superintendent’s integrated zoning proposal to open new schools…. the constant thread in the Board’s school operations was segregation, not neighborhood.”3 These decisions show policy manipulation, rather than the illegal measures that maintained separation.

Dimond further emphasizes the pattern: “throughout the entire history of the school system, the proof revealed numerous manipulations and deviations from ‘normal’ geographic zoning criteria in residential ‘fringes’ and ‘pockets,’ including optional zones, discontinuous attendance areas, intact busing, other gerrymandering and school capacity targeted to house only one race; this proof raised the inference that the board chose ‘normal’ geographic zoning criteria in the large one-race areas of the city to reach the same segregated result.”3  These adjustments were hard but effective in strengthening segregation by making sure even when schools were open, the location, and resource issuing meant that black students and white students would have different education environments. The school board’s actions show a bigger strategy for protecting the status quo under the “neighborhood” schools and making it understandable that segregation was not an accident but a policy.

On the other hand, Carl highlights the policy solutions that are considered for promoting integration, other programs which attract a multiracial, mixed-income student body. Redraw district lines and place new schools to maximize integration… busing does not seem to be an issue in Chicago…it should be obviously metro wide, because the school system is 75 percent minority.” [5]. This approach shows the importance of system solutions that go beyond busing, and integration requires addressing the issue of racial segregation in schools. Carl’s argument suggests that busing itself created a lasting change. By changing district lines, it is not just about moving the children around, but to change the issues that reinforce segregation.

Understanding Chicago’s segregation requires comparing northern and southern practices. Unlike the south, where segregation was organized in law, northern segregation was de facto maintained through residential patterns, local policies, and bureaucratic practices. Sugrue explains, “in the south, racial segregation before Brown was not fundamentally intertwined with residential segregation.”1. This shows how urban geography and housing discrimination shaped educational inequality in northern cities. In Chicago, racial restrictive, reddling, confined black families to specific neighborhoods, and that decided which school the children could attend. This allowed northern officials to say that segregation was needed more than as a policy.

Southern districts did not rely on geographic attendance zones to enforce separation; “southern districts did not use geographic attendance zones to separate black and whites.”1. In contrast, northern cities like Chicago used zones and local governance to achieve smaller results. Danns notes, “while legal restrictions in the south led to complete segregation of races in schools, in many instances the north represented de facto segregation, which was carried out as a result of practice often leading to similar results”4. This highlights the different methods by segregation across regions, even after the legal mandates for integration. In the south, segregation was enforced by the law, making the racial boundaries clear and intentional.

Still, advocacy groups were aware of the nationwide nature of this struggle. In a newspaper called “Key West Citizen” it says, “a stepped-up drive for greater racial integration in public schools, North and South is being prepared by “negro” groups in cities throughout the country.”  Resistance for integration could take extreme measures, including black children to travel long distances to go to segregated schools, while allowing white children to avoid those schools. In the newspaper “Robin Eagle” it notes, “colored children forced from the school they had previously attended and required to travel two miles to a segregated school…white children permitted to avoid attendance at the colored school on the premise that they have never been enrolled there.” [6] These examples show how resistance to integration represents a national pattern of inequality. Even though activist and civil rights groups fought for the educational justice, the local officials and white communities found ways to keep racial segregation. For black families, this meant their children were affected by physical and emotional burdens of segregation like, long commutes, bad facilities, and reminder of discrimination. On the other hand, white students received help from more funding and better-found schools. These differences show how racial inequality was within American education, as both northern and southern cities and their systems worked in several ways.

Understanding Chicago’s segregation requires comparing northern and southern practices. Unlike the south, where segregation was organized in law, northern segregation was de facto maintained through residential patterns, local policies, and bureaucratic practices. Sugrue explains, “in the South, racial segregation before Brown was not fundamentally intertwined with residential segregation.”1. This shows how urban geography and housing discrimination shaped educational inequality in northern cities. In Chicago, racial restrictive, reddling, confined black families to specific neighborhoods, and that decided which school the children could attend. This allowed northern officials to say that segregation was needed more than as a policy.

Southern districts did not rely on geographic attendance zones to enforce separation; “southern districts did not use geographic attendance zones to separate black and whites.”1 In contrast, northern cities like Chicago used zone and local governance to achieve smaller results. Danns notes, “while legal restrictions in the south led to complete segregation of races in schools, in many instances the north represented de facto segregation, which was carries out as a result of practice often leading to similar results”.4 This highlights the different methods by segregation across regions, even after the legal mandates for integration. In the South, segregation was enforced by the law, making the racial boundaries clear and intentional.

Yet the advocacy groups were aware of the nationwide nature of this struggle. In a newspaper called “Key West Citizen” it says, “a stepped-up drive for greater racial integration in public schools, North and South is being prepared by “negro” groups in cities throughout the country.” Resistance for integration could take extreme measure, including black children to travel long distances to go to segregated schools, while allowing white children to avoid those schools. These examples show how resistance to integration represents a national pattern of inequality. Even though activist and civil rights groups fought for educational justice, the local officials and white communities found ways to keep racial segregation. For black families, this meant their children were affected by physical and emotion burdens of segregation like, long commutes, bad facilities, and reminder of discrimination. On the other hand, white students received help from more funding and better-found schools. These differences show how racial inequality was within American education, as both northern and southern cities and their systems worked in several ways.

The policies that shaped Chicago schools in the 1950’s and 1960’s cannot be understood without looking at key figures such as Benjamin Willis and Harold Washington. Benjamin Willis, who was a superintendent of Chicago Public Schools from 1953 to 1966 and became known for his resistance to integration efforts. Willis’ administration relied on the construction of mobile classrooms, also known as “Willis wagons,” to deal with the overcrowding of Black schools. Other than reassigning students to nearby under-enrolled schools, Willis placed these classrooms in the yards of segregated schools. As Danns explains, Willis was seen by Chicagoans as the symbol of segregation as he gerrymandered school boundaries and used mobile classrooms (labeled Willis Wagons) to avoid desegregation.”4  . His refusal to implement desegregation measures made him a target of protest, including boycotts led by families and students.

On the other hand, Harold Washington, who would become Chicago’s first black mayor, represented a shift towards community-based reform and equality-based policies. Washington believed that equality in education required more than racial integration, but it needed structural investment in Black schools and economic opportunities for Black students. Jim Carl writes, Washington’s approach, “Washington would develop over the next thirty-three years, one that insisted on adequate resources for Black schools and economic opportunities for Black students rather than viewing school desegregation as the primary vehicle for educational improvement.”5 His leadership came from the earlier civil rights struggles of the 1950’s and 1960’s with the justice movements that came in the post-civil rights era.

Chicago’s experience in the mid-twentieth century provides an example of how racial segregation was maintained through policy then law.  In the postwar era, there was an increase in Chicago’s population. Daniel writes, “this increased the black school population in that period by 196 percent.”4. By the 1950’s, the Second Great Migration influenced these trends, with thousands of Black families arriving from the south every year. As Sugrue notes, “Blacks who migrated Northern held high expectations about education.” 1.   There was hope the northern schools would offer opportunities unavailable in the South. Chicago’s public schools soon became the site of racial conflict as overcrowding; limited resources, and administrative discrimination showed the limits of those expectations.

One of the features of Chicago’s educational system is the era of the “neighborhood schools” policy. On paper, this policy allowed students to attend schools near their homes, influencing the community. In practice, it was a powerful policy for preserving racial segregation. Sugrue explains, “in densely populated cities, schools often within a few blocks of one another, meaning that several schools might serve as “neighborhood”.”1. Because housing in Chicago was strictly segregated through redlining, racially restrictive areas, and de facto residential exclusion, neighborhood-based zoning meant that Black and white students were put into separate schools. This system allowed city officials to claim that segregation reflected residential patterns rather than intentional and avoiding the violation of Brown. A 1960 New York Times article called, “Fight on Floor now ruled out” by Anthony Lewis, revealed how Chicago officials publicly dismissed accusations of segregation while internally sustaining the practice. The article reported that school leaders insisted that racial imbalance merely reflected “neighborhood conditions” and that CPS policies were “not designed to separate the races,” even as Black schools operated far beyond capacity.”[7] This federal-level visibility shows that Chicago’s segregation was deliberate: officials framed their decisions as demographic realities, even though they consistently rejected integration measures that would have eased overcrowding in Black schools.

The consequences of these policies became visible by the 1960’s. Schools in Black neighorhoods were overcrowded, operating on double shifts or in temporary facilities. As Dionne Danns describes in Northern Desegregation: A Tale of Two Cities, she says, “before school desegregation, residential segregation, along with Chicago Public School (CPS) leaders’ administrative decisions to maintain neighbor-hood schools and avoid desegregation, led to segregated schools. Many Black segregated schools were historically under-resourced and overcrowded and had higher teacher turnover rates.”[8] The nearby white schools had empty classrooms and more modern facilities. This inequality sparked widespread community outrage, setting up the part for the educational protest that would define Chicago’s civil rights movement.

The roots of Chicago’s school segregation related to its housing policies. Redlining, the practice by which federal agencies and banks denied loans to Black homebuyers and systematically combined Black families to certain areas of the city’s south and west sides. These neighborhoods were often shown by housing stock, limited public investment, and overcrowding. Due to this policy, school attendance zones were aligned with neighborhood boundaries, these patterns of residential segregation were mirrored with the city’s schools. As historian Matthew Delmont explains in his book, Why Busing Failed, this dynamic drew the attention of federal authorities: “On July 4, 1965, after months of school protest and boycotts,  civil rights groups advocated in Chicago by filing a complaint with the U.S. Office of Education charging that Chicago’s Board of Education violated Title VI of the Civil Rights Act of 1964.”[9] This reflected how much intertwined housing and education policies were factors of racial segregation. The connection between where families could live and where their children could attend school showed how racial inequality was brought through everyday administrative decisions, and molding opportunities for generations of black Chicagoans.

These systems, housing, zoning, and education helped maintain a racial hierarchy under local control. Even after federal courts and civil rights organizations pushed for compliance with Brown, Chicago’s officials argued that their schools reflect demographic reality rather than discriminatory intent. This argument shows how city planners, developers, and school administrators collaborated. School segregation was not a shift from southern style Jim Crow, but a defining feature of North governance.

Chicago’s struggle with school segregation was not submissive. Legal challenges and community activism were tools in confronting inequalities. The NAACP Legal Defense Fund filed many lawsuits to challenge these policies and targeted the districts that violated the state’s education law. Parents and students organized boycotts and protests and wanted to draw attention to the injustices. Sugrue notes, “the stories of northern school boycotts are largely forgotten. Grassroots boycotts, led largely by mothers, inspired activists around the country to demand equal education”1.  The boycotts were not symbolic but strategic; community driven actions targeted at the system’s resistance to change. These movements represented an assertion of power from communities that had to be quiet by discriminatory policies. Parents, especially black mothers, soon became figures in these campaigns, using their voices, and organizing ways to demand responsibility from school boards and city officials. Their actions represented the change that would not come straight from the courtrooms, but from the people affected by injustice. The boycotts interrupted the normal school system and forced officials to listen to the demands for equal education. 

Danns emphasizes the range of activism during this period, writing in Chicago High School Students’ Movement for Quality Public Education: “in the early 1960’s, local and prominent civil rights organizations led a series of protests for school desegregation. These efforts included failed court cases, school boycotts, and sit-ins during superintendent Benjamin Willis administration, all which led to negligible school desegregation”[10]. Despite the limited success of these efforts, the activism of the 1960’s was important for exposing the morals of northern liberalism, and the continuing of racial inequalities outside the South. Student-led protests and communities organizing, not only challenged the policies of the Chicago Board of Education but also influenced the new generation for young people to see education as a main factor in the struggle for civil rights.

Legal tactics were critical in enforcing agreements. An article from the NAACP Evening Star writes, “on the basis of an Illinois statute which states that state-aid funds may be withheld from any school district that segregated based on race or color.” [11]The withholding of state funds applied pressure on resistant boards, showing that legal leverage could have consequences. When the board attempted to deny black students’ admission, the NAACP intervened.  In the newspaper “Evening Star”, They reported, “Although the board verbally refused to admit negro students and actually refused to do so when Illinois students applied for admission, when the board realized that the NAACP was going to file suit to withhold state-aid funds, word was sent to each student who had applied that they should report to morning classes.” [12]This shows how legal and financial pressure became one of the effective ways for enforcing desegregation. The threat of losing funds forced the school boards to work with the integration orders, highlighting the appeals were inadequate to undo the system of discrimination. The NAACP’s strategy displayed the importance of defense with legal enforcement, using the courts and states’ statutes to hold them accountable. This illustrated that the fight for educational equality required not only the protest, but also the legal base to secure that justice was to happen. This collaboration of legal action and grassroots mobilization reflects the strategy that raised both formal institutions and community power, showing the northern resistance to desegregation was far from being unchanged.

Chicago’s segregated schools had long-lasting effects on Black students, particularly through inequalities in the education system. Schools in Black neighborhoods were often overcrowded, underfunded, and provided fewer academic resources than their white counterparts. These disparities limited educational opportunities and shaped students’ futures. The lack of funding meant that schools could no longer afford placement courses, extracurricular programs, or even resources for classrooms, this shaped a gap in the quality of education between and black and white students. Black students in these kinds of environments were faced with educational disadvantages, but also less hope on their future.

Desegregation advocates sought to address both inequality and social integration. Danns explains, “Advocates of school desegregation looked to create integration by putting students of different races into the same schools. The larger goal was an end to inequality, but a by-product was that students would overcome their stereotypical ideas of one another, learn to see each other beyond race, and even create interracial friendships”4. While the ideal of desegregation included fostering social understanding, the reality of segregated neighborhoods and schools often hindered these outcomes. Even when legal policies aimed to desegregate schools, social and economic blockades continued to bring separation. Many white families moved to suburban districts to avoid integration. This created more classrooms to be racially diverse and left many of the urban schools attended by students of color.

The larger society influenced students’ experiences inside schools, despite efforts to create inclusive educational spaces. Danns explains, “In many ways, these schools were affected by the larger society; and tried as they might. Students often found it difficult to leave their individual, parental, or community views outside the school doors”9 Even when students developed friendships across racial and ethnic lines, segregated boundaries persisted: “Segregated boundaries remained in place even if individuals had made friends with people of other racial and ethnic groups”4. The ongoing influence of social norms and expectations meant that schools were not blinded by the racial tensions that existed outside their walls. While the teachers and administration may have tried to bring a more integrated environment, the racial hierarchies and prejudices in the community often influenced the students’ interactions. These hurdles were not always visible, but they shaped the actions within the school in fine ways. Despite the efforts at inclusion, the societal context of segregation remained challenging, and limited the integration and equality of education.

Beyond the social barriers, the practical issue of overcrowding continued to affect education. Carl highlights this concern, quoting Washington: “In interest, Washington stated that the issue ‘is not “busing,” it is freedom of choice. Parents must be allowed to move their children from overcrowded classrooms. The real issue is quality education for all’5. The focus on “freedom of choice” underscores that structural inequities, rather than simple policy failures, were central to the ongoing disparities in Chicago’s schools.

Overcrowding in urban schools was a deeper root to inequality. Black neighborhoods were often left with underfunded and overcrowded schools, while the white schools had smaller classes, and more resources. The expression of “freedom of choice” was meant to show that parents in marginalized communities should all have the same educational opportunity as the wealthier neighborhoods. However, this freedom was limited by residential segregation, unequal funding, and barriers that restricted many within the public school system.

The long-term impact of segregation extended beyond academics into the social and psychological lives of Black students. Segregation reinforced systemic racism and social divisions, contributing to limited upward mobility, economic inequality, and mistrust of institutions. Beyond the classroom, these affects shaped how the black students viewed themselves and where they stand in society. Psychologically, this often resulted in lower self-esteem and no academic motivation. Socially, segregation limited interactions between the different racial groups, and formed stereotypes. Overtime, these experiences came from a cycle in the issue of educational and government institutions, as black communities struggled with inequalities continuously.

  Black students were unprepared for the realities beyond their segregated neighborhoods, “Some Black participants faced a rude awakening about the world outside their high schools. Their false sense of security was quickly disrupted in the isolated college towns they moved to, where they met students who had never had access to the diversity they took for granted”9. This contrast between the relative diversity within segregated urban schools and the other environments illustrates how deeply segregation shaped expectations, socialization, and identity formation.

Even after desegregation policies were implemented, disparities persisted in access to quality education. Danns observes that, decades later, access to elite schools remained unequal: “After desegregation ended, the media paid attention to the decreasing spots available at the city’s top schools for Black and Latino students. In 2018, though Whites were only 10 percent of the Chicago Public Schools population, they had acquired 23 percent of the premium spots at the top city schools”7. This statistic underscores the enduring structural and systemic inequalities in the educational system. These inequalities show how racial privilege and access to resources favored by certain groups and disadvantaged others. Segregation has taken new ways, through economic and residential patterns rather than laws. This highlights the policy limitations, and brings out the need for more social, economic, and institutional change to achieve the goal of educational equality.

Segregation not only restricted access to academic resources but also had broader psychological consequences. By systematically limiting opportunities and reinforcing racial hierarchies, segregated schooling contributed to feelings of marginalization and diminished trust in public institutions. The experience of navigating a segregated school system often left Black students negotiating between a sense of pride in their communities and the constraints imposed by discriminatory policies. The lasting effects of these psychological scars were there long after segregation ended. The pain from decades of separation made it hard for many black families to believe in change that brought equality. Segregation was not an organized injustice, but also an emotional one; shaping how generations of students understood their worth, and connection to a system that let them down before.

The structural and social consequences of segregation were deeply intertwined. Overcrowded and underfunded schools have diminished educational outcomes, which in turn limit economic and social mobility. Social and psychological barriers reinforced these disparities, creating a cycle that affected multiple generations. Yet the activism, legal challenges, and community efforts described earlier demonstrate that Black families actively resisted these constraints, fighting for opportunities and equality. Their fight not only challenged the system’s injustice, but also laid a foundation for more civil rights reforms, and influencing future movements.

By examining Chicago’s segregation in the context of broader northern and national trends, it becomes clear that local policies and governance played an outsized role in shaping Black students’ experiences. While southern segregation was often codified in law, northern segregation relied on policy, zoning, and administrative practices to achieve similar results. The long-term impact on Chicago’s Black communities reflects the consequences of these forms of institutionalized racism, emphasizing the importance of both historical understanding and ongoing policy reform.

Chicago’s school segregation was not accidental or demographic, it was a product of housing, political and administrative decisions designed to preserve racial separation. The city’s leaders made a system that mirrored the thinking behind Jim Crow Laws and its legal framework, making northern segregation more challenging to see. Through policies made in bureaucratic language, Chicago Public Schools and city officials made sure that children got unequal education for decades.

The legacy of Chicago’s segregation exposes the character of educational inequality. Although activists, parents, and students fought to expose the challenges and the discrimination they created in the mid-twentieth century to continue to shape educational output today. Understanding the intentional design behind Chicago’s segregation is essential to understanding the persistence racial inequalities that defines American schooling. It is also a call to action reformers today to confront the historical and structural forces that have made these disparities. The fight for equitable education is not just about addressing the present-day inequalities but also dismantling the policies and systems that were built with the purpose of maintaining racial separation. The struggle for equality in education remains unfinished, and by acknowledging the choices that lead to the situation can be broken down by structures that continue to limit opportunities for future generations.

Evening Star. (Washington, DC), Oct. 23, 1963. https://www.loc.gov/item/sn83045462/1963-10-23/ed-1/.

Evening Star. (Washington, DC), Oct. 22, 1963. https://www.loc.gov/item/sn83045462/1963-10-22/ed-1/.

Evening Star. (Washington, DC), Sep. 8, 1962. https://www.loc.gov/item/sn83045462/1962-09-08/ed-1/.

Naacp Legal Defense and Educational Fund. NAACP Legal Defense and Educational Fund Records: Subject File, -1968; Schools; and States; Illinois; School desegregation reports, 1952 to 1956, undated. – 1956, 1952. Manuscript/Mixed Material. https://www.loc.gov/item/mss6557001591/.

The Robbins eagle. (Robbins, IL), Sep. 10, 1960. https://www.loc.gov/item/sn2008060212/1960-09-10/ed-1/.

The Key West citizen. (Key West, FL), Jul. 9, 1963. https://www.loc.gov/item/sn83016244/1963-07-09/ed-1/.

Carl, Jim. “Harold Washington and Chicago’s Schools between Civil Rights and the Decline of the New Deal Consensus, 1955-1987.” History of Education Quarterly 41, no. 3 (2001): 311–43. http://www.jstor.org/stable/369199.

Dionne Danns. 2020. Crossing Segregated Boundaries: Remembering Chicago School Desegregation. New Brunswick, New Jersey: Rutgers University Press. https://research.ebsco.com/linkprocessor/plink?id=a82738b5-aa61-339b-aa8a-3251c243ea76.

Danns, Dionne. “Chicago High School Students’ Movement for Quality Public Education, 1966-1971.” The Journal of African American History 88, no. 2 (2003): 138–50. https://doi.org/10.2307/3559062.

Danns, Dionne. “Northern Desegregation: A Tale of Two Cities.” History of Education Quarterly 51, no. 1 (2011): 77–104. http://www.jstor.org/stable/25799376.

Matthew F. Delmont; Why Busing Failed: Race, Media, and the National Resistance to School Desegregation

Philip T. K. Daniel. “A History of the Segregation-Discrimination Dilemma: The Chicago Experience.” Phylon (1960-) 41, no. 2 (1980): 126–36. https://doi.org/10.2307/274966.

Philip T. K. Daniel. “A History of Discrimination against Black Students in Chicago Secondary Schools.” History of Education Quarterly 20, no. 2 (1980): 147–62. https://doi.org/10.2307/367909.

Paul R. Dimond. 2005. Beyond Busing: Reflections on Urban Segregation, the Courts, and Equal Opportunity. [Pok. ed.]. Ann Arbor: University of Michigan Press. https://research.ebsco.com/linkprocessor/plink?id=76925a4a-743d-3059-9192-179013cceb31.

Thomas J. Sugrue. Sweet Land of Liberty: The Forgotten struggle for Civil Right in the North. Random House: NY.


[1] Thomas J. Sugrue, Sweet Land of Liberty: The Forgotten Struggle for Civil Rights in the North (New York: Random House, 2008),

[2] Philip T. K. Daniel, “A History of the Segregation-Discrimination Dilemma: The Chicago Experience,” Phylon 41, no. 2 (1980): 126–36.

[3]Paul R. Dimond, Beyond Busing: Reflections on Urban Segregation, the Courts, and Equal Opportunity (Ann Arbor: University of Michigan Press, 2005)

  1. [4]Dionne Danns, Crossing Segregated Boundaries: Remembering Chicago School Desegregation (New Brunswick, NJ: Rutgers University Press, 2020)

[5] Jim Carl, “Harold Washington and Chicago’s Schools between Civil Rights and the Decline of the New Deal Consensus, 1955–1987,” History of Education Quarterly 41, no. 3 (2001): 311–43.

[6] The Robbins Eagle (Robbins, IL), September 10, 1960,

[7]   The New York Times, “Fight on the Floor Ruled out,” July 27, 1960, 1.

[8] Dionne Danns, “Northern Desegregation: A Tale of Two Cities,” History of Education Quarterly 51, no. 1 (2011): 77–104.

[9] Matthew F. Delmont, Why Busing Failed: Race, Media, and the National Resistance to School Desegregation (Cambridge, MA: Harvard University Press, 2016).

[10] Dionne Danns, “Chicago High School Students’ Movement for Quality Public Education, 1966–1971,” Journal of African American History 88, no. 2 (2003): 138–50.

[11] NAACP Legal Defense and Educational Fund, Subject File: Schools; States; Illinois; School Desegregation Reports, 1952–1956, Manuscript Division, Library of Congress,

[12] Evening Star (Washington, DC), September 8, 1962,

Camden’s Public Schools and the Making of an Urban “Lost Cause”

In modern-day America, there is perhaps no city quite as infamous as Camden, New Jersey. A relatively-small urban community situated along the banks of the Delaware River, directly across from the sprawling, densely-populated urban metropolis of Philadelphia, in any other world, Camden would likely be a niche community, familiar only to those in the immediate surrounding area. However, the story of Camden is perhaps one of the greatest instances of institutional collapse and urban failure in modern America, akin to the catastrophes that befell communities such as Detroit, Michigan and Newark, New Jersey throughout the mid-twentieth century.

Once an industrial juggernaut, housing powerful manufacturing corporations such as RCA Victory and the New York Shipbuilding Corporation, Camden was perhaps one of the urban communities most integral to the American war effort and eventual victory in the Pacific Theatre in World War II. However, in the immediate aftermath of the war, Camden experienced significant decline, its once-prosperous urban hub giving way to a landscape of disinvestment, depopulation, and despair. By the late twentieth century  – specifically the 1980s and 1990s – Camden had devolved into a community wracked by poverty, crime, and drug abuse, bearing the notorious label “Murder City, U.S.A.” – a moniker which characterized decades of systemic inequity and institutional discrimination as a fatalistic narrative, presenting Camden as a city beyond saving, destined for failure. However, Camden’s decline was neither natural nor inevitable but rather, was carefully engineered through public policy. Through a calculated and carefully-measured process of institutional segregation and racial exclusion, state and city lawmakers took advantage of Camden’s failing economy and evaporating job market to confine communities of color to deteriorating neighborhoods, effectively denying them access to the educational and economic opportunities that had been afforded to white suburbanites in the surrounding area.

This paper focuses chiefly on Camden’s educational decline and inequities, situating the former within a broader historical examination of postwar urban America. Utilizing the historiographical frameworks of Arnold Hirsch, Richard Rothstein, Thomas Sugrue, and Howard Gillette, this research seeks to interrogate and illustrate how segregation and suburbanization functioned as reinforcements of racial inequity, and how such disenfranchisement created the perfect storm of educational failure in Camden’s public school network. The work of these scholars demonstrates that Camden’s neighborhoods, communities, and schools were intentionally structured to contain, isolate, and devalue communities and children of color, and that these trends were not unintended byproducts of natural spatial migration nor economic development. Within this context, it is clear that public education in the city of Camden did not simply mirror urban segregation, but rather institutionalized it as schools became both a reflection and reproduction of the city’s racial geography, working to entrench the divisions drawn by policymakers and real estate developers into a pervasive force present in all facets of life and human existence in Camden.

In examining the influence of Camden’s segregation on public education, this study argues that the decline of the city’s school system was not merely a byproduct, but an engine of institutional urban collapse. The racialized inequitable geography of public schooling in Camden began first as a willful and intentional byproduct of institutional disenfranchisement and administrative neglect, but quickly transformed into a self-fulfilling prophecy of failure, as crumbling school buildings and curricular inequalities became manifestations of policy-driven failure, and narratives of students of color as “inferior” were internalized by children throughout the city. Media portrayals of the city’s school system and its youth, meanwhile, transformed these failures into moral statements and narratives, depicting Camden’s children and their learning communities as symbols of inevitable dysfunction rather than victims of institutional exclusion. Thus, Camden’s transformation into the so-called “Murder Capital of America” was inseparable from the exclusionary condition of the city’s public schools, as they not only bore witness to segregation, but also became its most visible proof and worked to inform fatalistic narratives of the city and moral character of its residents.

            Historians of postwar America have long since established an understanding of racial and socioeconomic as essential to the development of the modern American urban and suburban landscape, manufactured and carefully reinforced throughout the twentieth century by the nation’s political and socioeconomic elite. Foundational studies include Arnold Hirsch’s “Making the Second Ghetto: Race and Housing in Chicago” (1983) and Richard Rothstein’s 1977 text, The Color of Law: A Forgotten History of How Our Government Segregated America serve to reinforce such traditional understandings of postwar urban redevelopment and suburban growth, situating the latter as the direct result of institutional policy, rather than mere byproducts and results of happenstance migration patterns.[1] In The Color of Law, Rothstein explores the role of federal and state political institutions in the codification of segregation through intergenerational policies of redlining, mortgage restrictions, and exclusionary patterns in the extension of mortgage insurance to homeowners along racial lines. In particular, Rothstein focuses on the Federal Housing Administration’s creation of redlining maps, which designated majority Black and Hispanic neighborhoods as high-risk “red zones,” effectively denying residents from these communities home loans, thus intentionally erecting barriers to intergenerational wealth accumulation through homeownership in suburban communities such as Levittown, Pennsylvania.[2]

            Hirsch’s “The Making of the Second Ghetto” echoes this narrative of urban segregation as manufactured, primarily through the framework of his “second ghetto” thesis. Conducting a careful case study of Chicago through this framework, Hirsch argues that local municipalities, urban developers/planners, and the business elite of Chicago worked in tandem to enact policies of “domestic containment,” wherein public housing projects were weaponized against Black and Hispanic communities to reinforce racial segregation throughout the city. Utilizing public housing as an anchor rather than tool of mobility, Chicago’s socioeconomic and political elite effectively conspired at the institutional level with one another to confine Black Chicagoans to closely-regulated low-income communities, devaluing land and property values in these areas whilst zoning more desirable land for redevelopment and suburban growth, thereby manually raising housing and movement costs to a level that Black Americans were simply unable to afford due to the aforementioned devaluation of their own communities as well as generational barriers to wealth accumulation.[3] Chris Rasmussen’s “Creating Segregation in an Era of Integration” applies such narratives to a close investigation of New Brunswick, New Jersey, particularly in regards to educational segregation, investigating how city authorities utilized similar institutional frameworks of racial separation to confine students to segregated schools and resist integration (school zoning, prioritization of white communities and schools for development, and segregationist housing placements), working off of the existing community segregation detailed by the work of Rothstein and Hirsch. [4]

            Working in tandem with historical perspectives of segregation as integral to the development of suburban America and subsequent urban decline, historians have also identified disinvestment as a critical economic process integral to the exacerbation of urban inequality, and eventual decay. Beginning in the postwar era, specifically in the aftermath of World War II and suburban development, industrial urban communities faced significant shortages in employment in the manufacturing sectors, as corporations began to outsource their labor to overseas and suburban communities, often following the migration of white suburbanites. Robert Beauregard’s Voices of Decline: The Post-War Fate of U.S. Cities diverges from the perspectives of Hirsch and Rothstein, citing declining employment opportunities and urban disinvestment as the most important factor in the decline of urban America on a national scale. Beauregard argues that by framing the disinvestment of urban wartime industrial juggernauts such as Newark, Camden, and Detroit as an “inevitability” in the face of rapid deurbanization and the growth of suburban America, policymakers at the national and local levels portrayed urban decline as a natural process, as opposed to a deliberate conspiracy to strip employment opportunities and the accumulation of capital from urban communities of color, even before suburbanization began to occur on a large scale.[5] Thomas Sugrue’s Origins of the Urban Crisis: Race and Inequality in Postwar Detroit also adheres to this perspective, situating economic devastation in the context of the development of racially-exclusive suburban communities, thereby working to tie existing scholarship and the multiple perspectives expressed here together, crafting a comprehensive narrative of urban decline in mid-twentieth century America as recurrent in nature, a cycle of unemployment, abject poverty, and a lack of opportunity that was reinforced by public policy and social programs that in theory, were supposed to alleviate such burdens.[6]

            Ultimately, while these sources focus on differing aspects of urban decline, they all work in tandem with one another to allow for a greater, comprehensive portrait of the causes of urban decay in postwar America, throughout the twentieth century. From deindustrialization to segregation and its influence on disparities in education, these sources provide absolutely essential context for an in-depth examination of the specific case study of Camden, New Jersey both in regards to the city itself, but also its public education system. While these sources may not all cite the specific example of Camden, the themes and trends identified each ring true and featured prominently in the story of Camden throughout this period.

            However, this paper will function as a significant divergence from such pre-existing literature, positioning the failure of public education in Camden as a key factor in the city’s decline, rather than a mere byproduct. A common trend present in much of the scholarship discussed above is that educational failure is examined not as a contributing root to Camden’s decline (and certainly not an important one, when education is briefly discussed in this context), but rather as a visible, tangible marker of urban decay in the area. While this paper does not deny the fact that failures in education are certainly rooted in fundamental inequity in urban spaces and broader social failings, it instead seeks to position Camden’s failing education state as not only a result of  urban decline, but as a contributor – specifically by engaging in a discussion of how educational failure transformed narratives around Camden as a failed urban community, beyond help and destined for ruin. In doing so, this paper advances a distinct argument: that Camden’s educational collapse must be understood not merely as evidence of urban decline, but as a foundational force that actively shaped—and in many ways intensified—the narrative of Camden as a city fated for failure.

Prior to launching into an exploration of Camden’s public schooling collapse and the influence of such failures of institutional education on the city’s reputation and image, it is important to first establish a clear understanding of the context of such shortcomings.  Due to this paper’s focus specifically on the institutional failure of Camden’s public schooling system, and how such failures shaped perceptions around the city as an urban lost cause, this section will focus primarily on rising rates of racial segregation in the mid-twentieth century, both within city limits and beyond, specifically in regards to Camden County’s sprawling network of suburban communities. While the factors of deindustrialization, economic failure, and governmental neglect absolutely do factor into the creation of an urban environment situated against educational success, racial segregation was chiefly responsible for the extreme disparities found in educational outcomes through the greater Camden region, and is most relevant to this paper’s discussion of racialized narratives of inevitable urban failure that proved to be so pervasive on a national scale regarding Camden, both within the mid-to-late twentieth century and into the present day.

Such trends date back to massive demographic transitions of the pre–World War II era was the Great Migration – the mass movement of Black Americans to northern industrial cities. Drawn by the promise of stable employment and the prospect of greater freedom and equality than was available in the Jim Crow South, millions of migrants relocated to urban centers along the Northeastern seaboard. Camden, New Jersey, was among these destinations, attracting a growing Black population throughout the early twentieth century due to its concentration of manufacturing giants such as RCA Victor, the New York Shipbuilding Corporation, and Campbell’s Soup.[7] With the outbreak of war in Europe in 1939—and especially following the United States’ entry into World War II after Pearl Harbor—industrial production in Camden surged. The city soon emerged as a vital hub of wartime manufacturing and domestic production, cementing its status as a key center of American industrial might.

As a direct result of its industrial growth and expanding wartime economy, Camden continued to attract both Black Americans and new immigrant populations, many of whom were of Latino descent. Among these groups were large numbers of Stateside Puerto Ricans, continuing a trend of immigration dating back to the 1917 extension of U.S. citizenship to Puerto Ricans.[8] Motivated by many of the same factors as Black migrants—chiefly the pursuit of steady employment and improved living conditions—these communities helped shape Camden into a diverse and vibrant urban center. The city’s population of color expanded rapidly during this period, its growth driven by wartime prosperity and the allure of industrial opportunity.

Following American victory in the Pacific and the end of World War II, Camden continued to experience rapid economic growth, although tensions arose between the city’s residents during this period along racial-ethnic lines. With the common American enemy of Japan and the Nazis firmly removed from the picture, hostilities began to turn inwards, and racial tensions skyrocketed, especially in the dawn of the Civil Rights Movement. As historian Chriss Rasmussen writes in “Creating Segregation in the Era of Integration: School Consolidation and Local Control in New Brunswick, New Jersey, 1965-1976”, “While Brown and the ensuing civil rights movement pointed toward racial integration, suburbanization forestalled racial equality by creating and reinforcing de facto segregation. As many whites moved to the suburbs, blacks and Latinos remained concentrated in New Jersey’s cities.”[9] Thus, as Black Americans increasingly emerged victorious in the fight against racial injustice and began to accumulate more and more rights and legal protections, city-dwelling white Americans grew increasingly fearful and resentful, spurring a mass exodus from urban population centers – including Camden. Drawn by federally backed mortgages, the expansion of highways, and racially exclusive housing policies,[10] white residents moved to neighboring suburbs such as Cherry Hill, Haddonfield, and Pennsauken, while structural barriers effectively excluded Black and Latino residents from the same opportunities. Leaving for the suburbs in droves, white residents fled from Camden, taking significant wealth and capital, as well as major business with them, thus weakening the city’s financial base and leaving workers—particularly people of color—vulnerable to unemployment.[11]

Public and private institutions increasingly withdrew resources from neighborhoods perceived as declining or racially changing and banks engaged in redlining, denying mortgages and loans to residents in nonwhite neighborhoods, while city budgets prioritized the needs of more affluent suburban constituencies over struggling urban areas.[12] Businesses and developers often chose to invest in suburban communities where white families were relocating, rather than in Camden itself, creating a feedback loop of declining property values, eroding tax revenue, and worsening public services. As historian Robert Beauregard writes in Voices of Decline: The Postwar Fate of U.S. Cities, “…while white middle-class and young working-class households had resettled in suburban areas, elderly and minority and other low-income households remained in the central cities. This increased the demand for basic public services (e.g. education) while leaving city governments with taxpayers having lower earnings and less property to tax.”[13] Thus, Camden residents left behind within the confines of the city became increasingly dependent on social welfare programs, which local and state governments began to fund less and less. This combination of economic retrenchment, racialized perceptions of neighborhood “desirability,” and policy-driven neglect fueled a cycle of disinvestment that disproportionately affected communities of color, leaving the city structurally disadvantaged.[14]

Concerns about racial integration in neighborhoods and schools also motivated many families to leave, as they sought communities aligned with their social and economic preferences. Such demographic change was rapid, and by 1950 approximately 23.8 percent of Camden City’s population was nonwhite.[15] While that figure may not seem extreme to the modern American, an individual likely familiar with diverse communities and perspectives, it is particularly shocking when placed in the context of Camden’s surrounding suburbs: by 1950, the nonwhite population of Pennsauken was a mere 4.5 percent,  2.1 percent in Haddonfield, and an even lower 1.9 percent in Cherry Hill.[16] These figures in particular serve as an exemplary demonstration as to the cyclical nature of segregation in the educational sector within the state of New Jersey, contextualizing twentieth century segregation not as a unique occurrence, but rather a continuation of historical patterns. In the nineteenth century, the majority of the state’s schools were segregated along racial lines, and in 1863, New Jersey’s state government directly sanctioned the segregation of public school districts statewide. While such decisions would ultimately be reversed in 1881, active opposition to integration remained into the twentieth century, particularly within elementary and middle school education. For example, a 1954 study found that New Jersey schools, both historically and actively, “…had more in common with states below than above…” the Mason-Dixon line. Most notably however, by 1940, the state had more segregated schools than at any period prior to the passing of explicit anti-segregation legislation in 1881.[17] Thus, it is evident that the state of Camden’s schools in the mid-twentieth century is not an isolated incident, but rather indicative of the cyclical nature of racial separation and disenfranchisement throughout the state of New Jersey in an educational context.

These demographic and economic shifts had profound implications for Camden’s schools, which now served largely Black and Latino student populations. In particular, Blaustein’s work proves particularly valuable in demonstrating the catastrophic impacts of white flight on Camden’s schools, as well as the irreversible harm inflicted on students of color as a result of institutional failures in education. Writing in a 1963 report to then-President John F. Kennedy’s – a cautious supporter of the Civil Rights Movement – Civil Rights Commission, notable civil rights lawyer Albert P. Blaustein establishes a clear portrait of the declining state of Camden’s public schooling system, as well as the everyday issues facing students and educators alike in the classroom. In delivering a scathing report on neighborhood segregation within the city in Camden, as demonstrated by demographic data regarding the race/ethnicity of students enrolled in public education across the Camden metropolitan area, Blaustein writes:

Northeast of Cooper River is the area known as East Camden, an area with a very small Negro population. For the river has served as a barrier against intracity population…Two of the four junior high schools are located here: Davis, which is 4.0 percent Negro and Veterans Memorial which is 0.2 percent Negro. Also located in East Camden are six elementary schools, four of which are all-white and the other two of which have Negro percentages of 1.3 percent and 19.7 percent…Central Camden, on the other hand, is largely Negro. Thus, the high percentage of Negroes in Powell (100.0 percent), Sumner (99.8 percent), Fetters (91.6 percent), Liberty (91.2 percent), and Whittier (99.1 percent), etc.[18]

Based on the data provided here by Blaustein, it is simply impossible to argue that racial segregation did not occur in Camden. Additionally, it becomes quite clear that while much discussion regarding Camden public schools and wide demographic changes in the city as a whole focuses on the movement of white residents to suburban areas, racial segregation and stratification absolutely did occur within the city, thus worsening educational opportunities and learning outcomes for Camden’s students of color even more.

            However, Blaustein does not end his discussion with segregation amongst student bodies, but rather extends his research even further to a close examination of racial/ethnic compositions of school leadership, including teachers, administrators, and school board members, yielding similar results. For example, according to his work, the Fetters School, possessing a student body of 91.6 percent Black students employed nine white teachers and nine Black teachers in 1960, but two white teachers and sixteen Black teachers in 1963. Even more shockingly, Central School, composed of 72.9 percent Black students, employed only white teachers in 1955. By 1963, just nine years later, this number had completely reversed and the school employed all Black educators.[19] Thus, Blaustein’s investigation of variances in Camden public schools’ racial composition reveal that this issue was not simply limited to education nor exclusionary zoning practices, but was rather an insidious demographic trend which had infested all areas of life in Camden, both within education and outside of classrooms. In ensuring that Black students were only taught by Black teachers and white students by white teachers, education in Camden was incredibly nondiverse, eliminating opportunities for cross-racial understanding nor exposure to alternative perspectives, thereby working to keep Black and white communities completely separate not just in the facets of residence and education, but also in interaction and socialization.

            With the existence of racial segregation both within Camden as well as the city’s surrounding area clearly established, we can now move to an exploration of inequalities in public education within the city. Perhaps one of the most visible and apparent markers of inequalities in public education in Camden can be found in school facilities and buildings. The physical conditions in which children of color were schooled were grossly and completely outdated, especially in comparison to the facilities provided to white children, both inside and outside of the city of Camden. For example, as of 1963, there were six specific public schools that had been cited as in dire need of replacement and/or renovation by Camden’s local legislative board, the vast majority of which were located in segregated communities: Liberty School (1856, 91.2% Black student population), Cooper School (1874, 30.7% Black student population), Fetters School (1875, 91.6% Black student population), Central School (1877, 72.9% Black student population), Read School (1887, 32.0% Black student population), and finally, Bergen School (1891, 45.6% Black student population).[20] Of the schools cited above, approximately half of the buildings that had been deemed by the city of Camden as unfit for usage and nonconducive to education were occupied by majority-Black student populations (Liberty, Fetters, and Central), whereas Bergen School was split just short of evenly between Black and white low-income students.

Additionally, it is important to acknowledge that these figures only account for the absolute worst of Camden’s schools, such trends in inadequate school buildings and facilities occurred throughout the city, in accordance with the general quality of infrastructure and housing present in each neighborhood they were located. In other words, while the data above only references a very small sample size of Camden’s schools, the trends reflected here (specifically, in the intentional zoning of Black students to old, run-down schooling facilities) serve as a microcosm of Camden’s public schools, wherein students of color were intentionally confined to older schools and run-down facilities.

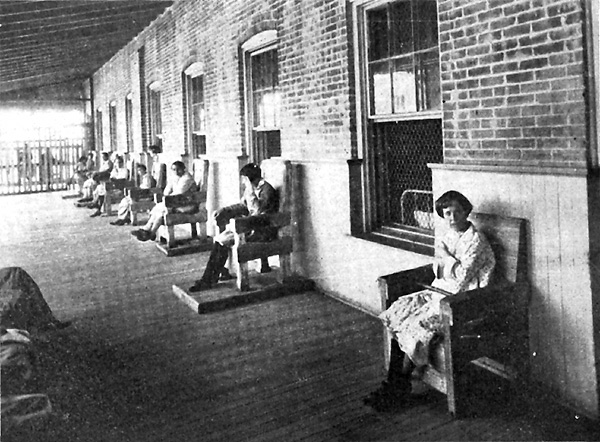
  Education researcher Jonathan Kozol expands on the condition of school facilities in Camden’s disenfranchised communities in his widely-influential book, Savage Inequalities. Written in 1991, Kozol’s work serves as a continuation of Blaustein’s discussion on the failing infrastructure of public education in Camden, providing an updated portrait into the classrooms serving the city’s poorest communities. Kozol pulls no punches in a truly visceral recollection of his visit to Pyne Point Middle School, writing:

…inside, in battered, broken-down, crowded rooms, teem the youth of Camden, with dysfunctional fire alarms, outmoded books and equipment, no sports supplies, demoralized teachers, and the everpresent worry that a child is going to enter the school building armed.[21]

Ultimately, it is inarguable that the physical quality of public schools and educational facilities in Camden was incredibly unequal, reflecting broader residential trends. Where poor, minority-majority neighborhoods experienced a degradation of property values and lived in dilapidated areas of the cities as a direct result of redlining and other racist housing policies, so too were children of color in Camden zoned into old, crumbling school buildings that by this time, barely remained standing, effectively stripping them of the same educational resources and physical comforts provided to white students both in the city and its neighboring suburbs.

            Such inequalities were also present in records of student achievement and morale. Educated in barely-standing school buildings overseen by cash-strapped school districts, students of color in Camden’s poor communities were not afforded nearly the same learning opportunities nor educational resources as white students in the area. In Camden and Environs, Blaustein cites Camden superintendent Dr. Anthony R. Catrambone’s perspective on inequalities in education, writing, “…pupils from Sumner Elementary School (99.8 percent Negro) who transfer to Bonsall Elementary School (50.3 percent Negro) ‘feel unwanted, and that they are having educational problems not experienced by the Negroes who have all their elementary training at Bonsall’ [Catrambone’s words].”[22]

            Thus, it is evident that inequalities in schooling facilities and instruction not only resulted in a considerable achievement gap between students in segregated and integrated communities, but also that such inequalities were clear and demonstrable, even to students themselves at the elementary level. Catrambone’s observation that students from Sumner felt “unwanted” and viewed themselves as struggling, suggests that students in Camden’s segregated neighborhoods internalized the city’s structural inequality, viewing themselves as lesser than their white/integrated peers both in intellectual capacity and personal character. Such perspectives, reinforced by the constant presence of systemic discrimination along racial lines as well as crumbling school facilities and housing units, became deeply entrenched in minds and hearts of Camden’s youth, thereby creating trends of educational failure that were cyclical in nature, reinforced both externally by social structures and institutions as well as internally within segregated communities of color.

            Similarly, dysfunction soon became synonymous with segregated schools and low-income communities of color at the institutional level. School administrators and Boards of Education began to expect failure of students of color, stripping away any opportunity for such schools to prove otherwise. For example, Camden’s school leadership often designated rigorous curriculums and college-preparatory courses to majority-white schools, neglecting to extend the same opportunities to minority-majority districts. For example, in reporting on administrative conversations on the potential integration of Camden High School in 1963, Blaustein observes:

The maintenance of comprehensive academic tracks was recognized by administration as dependent on white students, implying students of color alone were not expected to sustain them: ‘if these pupils [white college preparatory students from the Cramer area] were transferred to Woodrow Wilson [a majority-Black high school located in the Stockton neighborhood], Camden High would be almost entirely a school for business instruction and training in industrial arts.[23]

It is vital to first provide context as to Blaustein’s usage of the terms “business instruction” and “industrial arts.” In utilizing these terms, Blaustein refers primarily to what is referred to as “vocational education” in modern-day America. With this crucial context firmly established, it becomes evident that public educators in early-1960s Camden viewed college education as a racially-exclusive opportunity, to be extended only to white students.

Such attitudes were reflected in the curricular rigor present in Camden’s minority-majority schools which were, to say the least, held to an extremely low standard. The lessons designed for children of color were incredibly simple and non-complex, as schools were treated less as institutions of learning and self-improvement, but rather as detention centers for the city’s disenfranchised youth. As Camden native and historian David Bain writes in the piece Camden Bound, “History surrounds the children of Camden, but they do learn a lot of it in school…Whitman is not read by students in the basic skills curriculum. Few students that I met in Camden High, indeed, had never heard of him.”[24] As such, Black and Hispanic students were effectively set up for failure as compared to white students, viewed as predestined to either not graduate from their primary schooling or to enter lower-paying careers and vocational fields rather than pursue higher education, and opportunities that college afforded students, particularly during this period where college degrees were significantly rarer and highly-valued than in the modern day.

            Thus, it is evident that throughout the mid-twentieth century Camden’s public school system routinely failed Black and Hispanic students. From inequalities in school facilities and curriculum, Camden’s public school system repeatedly communicated to students in segregated areas that they simply were not worth the time and resources afforded to white students, nor possessed the same intellectual capacity as suburban children. Denied quality schools and viewed as predestined high school drop-outs, Camden’s public schools never truly invested in their children, creating an atmosphere of perpetual administrative negligence in improving schools and learning outcomes for the city’s disadvantaged youth. As Blaustein so aptly writes, “‘…the school authorities are against changing the status quo. They want to avoid headaches. They act only when pressures are applied’”.[25]

It is clear that such drastic disparities in learning outcomes arose not only out of administrative negligence, but also as a direct result of segregation within the city. While no law affirming segregation was ever passed in New Jersey, it is clear that schools in Camden were completely and unequivocally segregated, and that a hierarchical structure clearly existed in regards to determining which schools and student populations were most supported and prepared for success. Time and time again, educators favored white students and white schools, kicking students of color and their schooling communities to the curb. It is against this backdrop of negligence and resignation that wider narratives around the city of Camden and its youth as “lost causes” beyond any and all help began to emerge.

By the late twentieth century (specifically the 1980s and 1990s), narratives around Camden as a drug and crime-infested urban wasteland began to propagate, rising to a national scale in the wake of increasing gang activity and rapidly-rising crime rates in the area. While public focus centered on the city’s criminal justice department and woefully-inept political system, reporting on the state of Camden’s public schools served to reinforce perceptions of the city as destined for failure and beyond saving, chiefly through local press’ demonization of Camden’s youth. For example, the Courier Post article “Battle being waged to keep youths from crime”, reads, “‘Girls are being raped in schools, drugs are proliferating, alcohol is proliferating, and instead of dealing with it, some parents and administrators are in denial…they insist it’s not happening in their backyard’”.[26] The manner in this author speaks of public schooling in Camden reads as though the city’s schools and places of education were not learning communities, but rather prisons – the students inhabiting these spaces not children, but prisoners, destined to be nothing more than a “thug”.

  Ignoring the city’s long history with racial segregation and redlining, which as established earlier in this paper, clearly resulted not only in disparities in learning outcomes but also caused a deep internalization of institutional failure within many students of color and their learning communities, articles such as this neglect the willingness to truly explore the roots of crime and poverty in Camden, focusing instead on the result of decades of institutional neglect of communities of color, rather than the root cause of these issues. In doing so, media coverage of such failures in Camden removed the burden of responsibility from the city lawmakers and school administrators responsible for abject poverty and educational disparities, instead putting the onus on the communities which were intentionally and perpetually disenfranchised at the institutional level across all aspects of Camden’s sociopolitical network.

Additionally, this article’s veiled assertion of Camden parents as disinterested and uninvested in their children’s success is especially gross and inaccurate. The fact of the matter is that parents and local communities within even the most impoverished and crime-ridden neighborhoods of Camden had long-lobbied for improvements to public schooling and their communities, concerned chiefly with their children’s futures and opportunities. For example, by the late 1990s, Camden City’s charter network had experienced significant growth, much of its early success owed directly to parents and grassroots organizations devoted to improving the post-schooling opportunities of disadvantaged children. In 1997, over seventeen new charters were approved by the city of Camden, the first opening in September of that year. The LEAP Academy University Charter School was the result of years of political lobbying and relentless advocacy, of which the loudest voices came from parents and community activist groups. Spearheaded by Rutgers University-Camden professor and city native, Gloria Bonilla-Santiago, the LEAP Academy included specific parent action committees, community outreach boards, and sponsored numerous community service events.[27] Thus, this inclusion of virtually one of the only groups truly invested in children of color’s success in Camden alongside the group which repeatedly conspired to confine them to crumbling schools and prepare them only for low-paying occupations is wildly inaccurate and offensive in a historical context, thereby demonstrating how media narratives around Camden and its school system repeatedly disregarded factually-correct reporting, in favor of sensationalized reports on Camden’s struggles, framing schools and city youth as ground zero and progenitors of the wider issues facing the city as a whole.

While community activism was absolutely present across Camden, it is also important to highlight the damaging impact of such negative narratives surrounding the city on its residents. In his book Camden Bound, a literary exploration of the history of Camden and its community, Camden-born historian David Bain highlights the internalization of damaging, sensationalized descriptions of Camden. He writes:

For most of my life, my birthplace, the city of Camden, has been a point of irony, worth a wince and often hasty explanation that though I was born in Camden, we didn’t actually ever live in Camden, but in a succession of pleasant South Jersey suburban towns…As I moved through life…I would write out the name Camden (I’m ashamed to name my shame now) with a shudder.[28]

While Bain’s Camden Bound does relate specifically to his own individual experience and struggle with the acknowledgement of his birthplace in the wake of national infamy, he spends perhaps even more time exploring the current state of the city, as well as the perspectives of current Camden residents. In recounts his most recent visit to Camden, Bain describes nothing short of absolute devastation and complete social blight and urban decay, writing:

Too many newspaper headlines crowd my brain – “Camden Hopes for Release From Its Pain”; “In Struggles of the City, Children Are Casualties”; “Camden Forces Its Suburbs To Ask, What If a City Dies?”; “A Once Vital, Cohesive Community is Slowly, but Not Inevitably, Dying.” And that devastating question from Time: “Who Could Live Here?”…It has been called the poorest city in New Jersey, and some have wondered if it is the poorest in the nation. Adult men and women stand or sit in front of their shabby two- story brick houses, stunned by purposelessness. In abandoned buildings, drug dealers and their customers congregate. On littered sidewalks, children negotiate through broken glass, condoms, and spent hypodermics.[29]

Judging from Bain’s simple description of the sights that he witnessed while driving through Camden, it is evident that Camden’s residents have been burned out by the widely-circulating narratives of the city and its national infamy. The vast majority of residents poverty-stricken and lacking the financial or social capital to create meaningful change for their communities themselves, such headlines and narratives of the city were nothing short of absolutely devastating. Such soul-crushing portrayals signal yet another air of perpetual negligence and resignation by powerful voices, within the media, local politics, and even national government, thus demonstrating a national perception of Camden as “failed”, and were thus internalized by Camden’s residents.

For example, in interviewing Rene Huggins, a community activist and director of the Camden Cultural Center, Bain chiefly relays her frustration with recent state legislation upon the assumption of office by Republican governor Christine Todd Whitman and recent rollbacks of welfare programs, occupational training, and educational funding that had been promised to the city. Speaking on the increasing hopelessness of many city residents, Huggins states, “And on top of all that…we get that headline in Time magazine – ’Who Could Live Here?’ Why not just give us a lot of shovels and bury the place?’”.[30] Such statements, alongside Bain’s experiences of Camden, thus demonstrate that as a direct result of national resignation to the state of Camden and a lack of willingness nor initiative to improve the city (and even more damaging, a removal of resources and social initiatives designed specifically to improve the state of the city), many Camden residents adopted a similar mentality of resignation and shame toward their community, choosing to simply exist with the city’s misery as opposed to creating any real, meaningful change, having been spurned and failed by various powerful sociopolitical institutions and organizations across generations, thereby reinforcing the harmful narratives that had played such a crucial role in the development of such behaviors.

The very article mentioned in ire by Ren Huggins, Kevin Fedarko’s “Who Could Live Here?”, also offers insight into public perceptions of Camden and more specifically, its youth, during the late twentieth-century. Written in 1992, Fedarko postures the city of Camden as a barren wasteland and its inhabitants – predominantly young people and children – as akin to nothing more than prisoners and criminals. For example, Fedarko writes:

The story of Camden is the story of boys who blind stray dogs after school, who come to Sunday Mass looking for cookies because they are hungry, who arm themselves with guns, knives and — this winter’s fad at $400 each — hand grenades. It is the story of girls who dream of becoming hairdressers but wind up as whores, who get pregnant at 14 only to bury their infants.[31]

Fedarko’s description of Camden’s children is extraordinarily problematic, in that it not only treats the city’s youth as a monolithic group, but then proceeds to demonize them en masse. In describing the city’s young people as baselessly sadistic and violent, while neglecting to position rising youth crime rates in the context of historical disenfranchisement nor take a moment and pause to acknowledge that this is not the case for all of the city’s young people, Fedarko’s work only furthers narratives of Camden and its young people as lawless and destined for jail cells rather than degrees. In particular, Fedarko’s description of Camden’s young women as “whores” is especially gross, considering the fact that the people of whom Fedarko speaks are children, thereby applying unnecessary derogatory labels to young women (largely women of color), while failing to acknowledge the true tragedy of Camden and the conditions to which young people are subjected to. In describing the situation of a teenager involved in gang activity, Fedarko also employs similarly disrespectful and dehumanizing language, writing:

…drug posses …use children to keep an eye out for vice- squad police and to ferry drugs across town. Says “Minute Mouse,” a 15- year-old dealer: “I love my boys more than my own family.” Little wonder. With a father in jail and a mother who abandoned him, the Mouse survived for a time by eating trash and dog food before turning to the drug business.[32]

Ultimately, it is evident that during the late twentieth century, specifically the eighties and nineties, narratives surrounding Camden portrayed the city as nothing more than an urban wasteland and lost cause, a sad excuse for urban existence that eschewed its history as a sprawling manufacturing juggernaut. More damaging however, were narratives surrounding the people of Camden (especially youth), who became synonymous with violence and criminal activity, rather than opportunity or potential. In short, media coverage of Camden was concerned chiefly with the concept of an urban space and people in chaos and thus, prioritized the spectacle of Camden’s failures over the historical tragedy of the city, neglecting to situation the former in the context of self-imposed de facto segregation and racialized disenfranchisement.

Ultimately, it cannot be denied that perceptions of Camden’s public education system as failing and its youth as morally debased were absolutely essential to the formulation of “lost cause” narratives regarding the city. In the popular imagination, Camden became synonymous with decay and dysfunction—a city transformed from a thriving industrial hub into what national headlines would later call “Murder City, U.S.A.” However, these narratives of inevitability in truth emerged from the city’s long history with racial segregation, economic turmoil, and administrative educational neglect. Camden’s schools were central to this development, acting as both products and producers of inequity, serving as clear symbols of the failures in public policy, which were later recast as moral shortcomings of disenfranchised communities themselves.

As demonstrated throughout this study, the structural roots of Camden’s failures in public education were grounded in segregation, manufactured by the same redlining maps and exclusionary residency policies that confined families of color to the city’s most desolate neighborhoods, which would also determine the boundaries of their children’s schools. White flight and suburban migration drained Camden of its capital and tax base, instead concentrating such resources in suburban communities whose already-existing affluence was only reinforced by federal mortgage programs and social support. Historical inquiry into urban decline and the state of urban communities in the postwar period have long since emphasized the importance of understanding urban segregation not as a natural social phenomenon, but rather an architectural inequity, extending into every aspect of civic life and education. Camden’s experience confirms this: segregation functioned not only as a physical division of space but as a moral and ideological one, creating the conditions for policymakers and the media to portray the city’s public schools as evidence of cultural pathology rather than systemic betrayal.

By the late twentieth century, these narratives had become fatalistic. Newspaper headlines depicted Camden’s classrooms as sites of chaos and its youth as violent, transforming real inequities into spectacle. The children who bore the weight of these conditions—students of color educated in crumbling buildings and underfunded programs—were cast as perpetrators of their city’s demise rather than its victims. The label “Murder Capital” distilled these complexities into a single, dehumanizing phrase, erasing the structural roots of decline in favor of a narrative that made Camden’s suffering appear inevitable. In doing so, public discourse not only misrepresented the city’s reality but also justified further disinvestment, as policymakers treated Camden’s collapse as a moral failure rather than a product of policy.

However, despite such immense challenges and incredibly damaging narratives that had become so deeply entrenched in the American national psyche regarding the city, Camden and its inhabitants persisted. Refusing to give up on their communities, Camden’s residents, many of whom lacking the influence and capital to create change alone, chose to band together and weather the storm of national infamy. From community activism to political lobbying, Camden’s communities of color demonstrated consistent self-advocacy. Viewing outside aid as perpetually-promised yet never provided, Camden’s communities pooled their resources and invested in their own communities and children, establishing vast charter networks as well as advocating for criminal justice reform and community policing efforts.

While change was slow and seemingly unattainable, Camden has experienced a significant resurgence in the past decade or so. From investment by major corporations and sports organizations (for example, the Philadelphia 76ers’ relocation of their practice facilities and front offices to the Camden Waterfront in 2016) as well as a revitalization of educational access and recruitment of teaching professionals by the Camden Education Fund, the city has slowly begun to reverse trends of decay and decline, pushing back against narratives that had deemed its failure as inevitable and inescapable. Celebrating its first homicide-free summer this year, Camden’s story is tragic, yet far from over. Rather than adhere to the story of persistent institutional failure and disenfranchisement, Camden’s residents have chosen to take charge of the narrative of their home and communities for themselves, changing it to one of perseverance, determination, and strength. In defiance of decades of segregation, disinvestment, and stigma, Camden stands not as America’s “Murder City,” but as its mirror—a testament to how injustice is built, and how, through resilience, effort, and advocacy, it can be torn down.

 “The case for charter schools,” Courier Post, March 02, 1997

Bain, David Haward. “Camden Bound.” Prairie Schooner 72, no. 3 (1998): 104–44. http://www.jstor.org/stable/40637098 

Beauregard, Robert A. Voices of Decline: The Postwar Fate of U.S. Cities. 2nd ed. New York: Routledge, 2003 http://www.123library.org/book_details/?id=112493

Blaustein, Albert P., and United States Commission on Civil Rights. Civil Rights U.S.A.: Public Schools: Cities in the North and West, 1963: Camden and Environs. Washington, DC: United States Commission on Civil Rights, 1964.

Douglas, Davison M. “The Limits of Law in Accomplishing Racial Change: School Segregation in the Pre-Brown North.” UCLA Law Review 44, no. 3 (1997): 677–744.

Fedarko, Kevin. “The Other America.” Time, January 20, 1992. https://content.time.com/time/subscriber/article/0,33009,974708-3,00.html

Gillette, Howard. Camden after the Fall: Decline and Renewal in a Post-Industrial City. Philadelphia: University of Pennsylvania Press, 2005.

Goheen, Peter G., and Arnold R. Hirsch. “Making the Second Ghetto: Race and Housing in Chicago, 1940-1960.” Labour / Le Travail 15 (1985): 234. https://doi.org/10.2307/25140590

Kozol, Jonathan. Savage Inequalities: Children in America’s Schools. New York: Broadway Books, 1991.

Rasmussen, Chris. “Creating Segregation in the Era of Integration: School Consolidation and Local Control in New Brunswick, New Jersey, 1965–1976.” History of Education Quarterly 57, no. 4 (2017): 480–514. https://www.jstor.org/stable/26846389

Rothstein, Richard. The Color of Law : A Forgotten History of How Our Government Segregated America. First edition. New York: Liveright Publishing Corporation, a division of W.W. Norton & Company, 2017.

Sugrue, Thomas J. The Origins of the Urban Crisis: Race and Inequality in Postwar Detroit. Princeton, NJ: Princeton University Press, 1996.

Tantillo, Sara. “Battle being waged to keep youths from crime,” Courier Post, June 8, 1998

Yaffe, Deborah. Other People’s Children: The Battle for Justice and Equality in New Jersey’s Schools. New Brunswick, NJ: Rivergate Books, 2007. https://search.ebscohost.com/login.aspx?direct=true&scope=site&db=nlebk&db=nlabk&AN=225406


[1] Peter G. Goheen and Arnold R. Hirsch. “Making the Second Ghetto: Race and Housing in Chicago, 1940-1960.” Labour / Le Travail 15 (1985): 234.

[2] Richard Rothstein. The Color of Law : A Forgotten History of How Our Government Segregated America. First edition. New York: Liveright Publishing Corporation, a division of W.W. Norton & Company, 2017.

[3] Peter G. Goheen and Arnold R. Hirsch. “Making the Second Ghetto: Race and Housing in Chicago, 1940-1960.” Labour / Le Travail 15 (1985): 234.

[4] Chris Rasmussen. “Creating Segregation in the Era of Integration: School Consolidation and Local Control in New Brunswick, New Jersey, 1965–1976.” History of Education Quarterly 57, no. 4 (2017): 480–514.

[5] Robert A. Beauregard. Voices of Decline: The Postwar Fate of U.S. Cities. 2nd ed. New York: Routledge, 2003.

[6] Thomas J. Sugrue. The Origins of the Urban Crisis: Race and Inequality in Postwar Detroit. Princeton, NJ: Princeton University Press, 1996.

[7] Howard Gillette, Camden after the Fall: Decline and Renewal in a Post-Industrial City (Philadelphia: University of Pennsylvania Press, 2005), 12–15.

[8] David Howard Bain, “Camden Bound,” Prairie Schooner 72, no. 3 (1998): 104–44.

[9] Chris Rasmussen,. “Creating Segregation in the Era of Integration: School Consolidation and Local Control in New Brunswick, New Jersey, 1965–1976.” History of Education Quarterly 57, no. 4 (2017): p.487

[10] Richard Rothstein, The Color of Law: A Forgotten History of How Our Government Segregated America (New York: Liveright, 2017), 70–75; Gillette, Camden after the Fall, 52–54.

[11] Gillette, Camden after the Fall, 45–50; Bain, “Camden Bound,” 110–12.

[12] Thomas J. Sugrue, The Origins of the Urban Crisis: Race and Inequality in Postwar Detroit (Princeton, NJ: Princeton University Press, 1996), 35–40.

[13] Beauregard, Robert A. Voices of Decline : The Postwar Fate of U.S. Cities. Second edition. New York: Routledge, 2003, 91

[14] Gillette, Camden after the Fall, 50–55; Bain, “Camden Bound,” 120.

[15]Albert P. Blaustein, Civil Rights U.S.A.: Camden and Environs, report to the U.S. Civil Rights Commission, 1963, 22.

[16] Blaustein, Civil Rights U.S.A., 23–24.

[17]Davison M. Douglas, “The Limits of Law in Accomplishing Racial Change: School Segregation in the Pre-Brown North.” UCLA Law Review 44, no. 3 (1997)

[18] Blaustein, Civil Rights U.S.A., 18.

[19] Blaustein, Civil Rights U.S.A., 18.

[20] Blaustein, Civil Rights U.S.A.,

[21] Kozol, Jonathan. Savage Inequalities : Children in America’s Schools. New York: Broadway Books, an imprint of the Crown Publishing Group, a division of Random House, Inc., 1991.

[22] Blaustein, Civil Rights U.S.A., 22.

[23] Blaustein, Civil Rights U.S.A.,

[24] Bain, David Haward. “Camden Bound.” Prairie Schooner 72, no. 3 (1998): 120-121.

[25] Blaustein, Civil Rights U.S.A.,

[26] “Battle being waged to keep youths from crime,” Courier Post, June 8, 1998

[27] Sarah Tantillo, “The case for charter schools,” Courier Post, March 02, 1997

[28] Bain, Camden Bound, 108-109.

[29] Bain, Camden Bound, 111.

[30] Bain, Camden Bound, 119.

[31] Kevin Fedarko, “The Other America,” Time, January 20, 1992

[32] Ibid.

Civics Era 10 – The Great Depression and the New Deal (1929-1945)

www.njcss.org

The relationship between the individual and the state is present in every country, society, and civilization. Relevant questions about individual liberty, civic engagement, government authority, equality and justice, and protection are important for every demographic group in the population.  In your teaching of World History, consider the examples and questions provided below that should be familiar to students in the history of the United States with application to the experiences of others around the world.

These civic activities are designed to present civics in a global context as civic education happens in every country.  The design is flexible regarding using one of the activities, allowing students to explore multiple activities in groups, and as a lesson for a substitute teacher. The lessons are free, although a donation to the New Jersey Council for the Social Studies is greatly appreciated. www.njcss.org

The beginning of the 20th century marks the foundation of the transformation of the United States into a world power by the middle of the century. In this era economic prosperity and depression, the ability of our government to provide for the needs of people experiencing economic hardship, and the rise of dictators attacking innocent civilians and threatening the existence of democratic governments leading to a second world war dominate the narrative of this historical period. The development of the new technologies of electricity, transportation, and communication challenged our long-held traditional policies of limited government, neutrality, and laissez-faire capitalism.

In the 1930s, Father Charles Coughlin, a Roman Catholic priest, had a weekly radio program with millions of listeners in the United States. In 1926 he broadcast weekly sermons but as the economy shifted into a recession and depression, his broadcast became more political and economic. They also reflected anti-Semitism with verbal attacks on prominent Jewish citizens. His broadcast following Kristallnacht on November 10, 1938 was particularly divisive. The owner of WMCA, a New York station, refused to broadcast Father Coughlin’s messages

The owner of WMCA, the New York station that carried his program, refused to broadcast Coughlin’s next radio message. The Nazi press reacted to the news with fury: “America is Not Allowed to Hear the Truth” declared one headline. “Jewish organizations camouflaged as American…have conducted such a campaign…that the radio station company has proceeded to muzzle the well-loved Father Coughlin.” A “New York Times” correspondent in Germany noted that Coughlin had become for the moment “the hero of Nazi Germany.” 

In the United States the Federal Communications Act of 1934 and subsequent additions regarding television and quiz shows mostly protects licenses, ensures equal access to all geographic areas, and provides for a rapid communications system regarding emergencies and national defense. It protects First Amendment rights regarding content, with some restrictions regarding profanity or inappropriate sexual content or images. The absence of specific content regulations allowed Orson Welles in 1938 to produce “War of the Worlds” over the radio leading to a panic by many citizens regarding their fear of an alien invasion.  The Fairness Doctrine of 1949 requires broadcasters to allow responses to personal attacks and controversial opinions. In 1969, the U.S. Supreme Court’s decision in Red Lion Broadcasting Co., Inc. v. Federal Communications Commission challenged the constitutionality of the Fairness Doctrine allowing the popularity of political radio and television talk and news programs.

Federal Communications Act of 1934

Broadcast Media Policy in the United Kingdom

The use of public media in the United Kingdom has specific statues to balance the perspectives of opinions and to prevent or limit the public broadcast media as a platform to present the views of the government, propaganda, or to advocate for a particular point of view on a controversial issue. The diversity of opinion in the United Kingdom for the BBC must respect opinions reflecting urban and rural populations, age, income, geography, culture, and political affiliations. There are also reasonable guidelines regarding the editor’s judgment to exclude a particular perspective. Facts and opinions must be defined and clearly stated.   Section 4 Impartiality: 4.3.14     BBC Editorial Policy

In the United States, deposits in most banks are protected up to $250,000 for each investor. This protection restored confidence in American banks during the Great Depression and is an important reason for a sound financial system in the United States. Investments in stocks and bonds fluctuate with market conditions.  Every bank in the United States also has deposits that are not insured. Investments in stocks, mutual funds, and corporate bonds are not insured by the Federal Deposit Insurance Corporation.

The Federal Reserve Bank establishes a reserve requirement, currently 10%, for banks to maintain to ensure adequate funds for withdrawals. The Federal Reserve Bank also monitors the member banks in the Federal Reserve System. Banks are assessed on all of their deposits quarterly and a formula is used to calculate their insurance payment. The FDIC is self-insured, although backed by Congress in the event of a catastrophic collapse of the banking system.

In Japan, the Deposit Insurance Act was enacted in 1971. The DIA fully insures deposits that do not earn interest.  In the United States amounts in checking, savings, money market accounts, and Certificates of Deposit are insured. Deposits that earn interest in Japan are insured up to 10 million yen, or about $70,000.

The most recent crisis in Japan is the exposure of the Aozora Bank to bad loans and investments in the United States. In 2024, it posted a net loss of 28 billion Japanese yen or about $191 million in U.S. dollars. A major earthquake in Japan, effects from extreme weather, or a military conflict would likely present major risks to Japan’s banks.

Examples of countries without any defined deposit insurance are China, Egypt, Israel, Pakistan, and South Africa. Perhaps one-third of the countries in the world do not protect deposits in their banks.

Failed Banks in the U.S. by Year (Forbes)

Federal Deposit Insurance Corporation

Video: FDIC (13 minutes)

Japan’s Banking Crisis in the 1990s (Video)

Huey P. Long is a challenging person for historians and educators. His ‘Share the Wealth’ program, use of the media, authoritarian actions, and criticisms of voter manipulation provide for diverse perspectives. However, he improved healthcare in Louisiana by expanding the Charity Hospital System, creating the Louisiana State University Medical School, reforming institutions to care for the disabled and mentally challenged, and providing free health clinics and immunizations. As a result, many lives were saved.

As governor, Long tripled funding for public healthcare. The state’s free health clinics grew from 10 in 1926 to 31 in 1933, providing free immunizations to 67 percent of the rural population. By building bridges and paving new roads, he made it possible for the rural poor to have access to medical and dental health care and hospitals. In the long historical timeline toward universal health care insurance in the United States, Huey P. Long is a pioneer.

Before Huey Long’s reforms, patients at the Central Hospital for the Insane were locked in chairs during their ‘recreation’ time.  from Every Man a King by Huey Long; reproduced by permission.

Long by-passed the negative press by distributing his own newspaper, “The American Progress,” and he spoke directly to a national audience through radio speeches and speaking engagements. In a national radio broadcast on February 23, 1934, Huey Long unveiled his “Share Our Wealth” plan a program designed to provide a decent standard of living to all Americans by spreading the nation’s wealth among the people. Long proposed capping personal fortunes at $50 million each (roughly $600 million in today’s dollars) through a restructured, progressive federal tax code and sharing the resulting revenue with the public through government benefits and public works. In addition, he advocated for a 30 hour work week, four weeks of paid vacation for every worker, free college or vocational educational and limiting annual incomes to $1 million or about $60 million in today’s dollars. He also advocated for pensions and health care provided by businesses and the government.

Long believed that it was morally wrong for the government to allow millions of Americans to suffer in poverty when there existed a surplus of food, clothing, and shelter. By 1934, nearly half of all American families lived in poverty, earning less than $1,250 annually.  He supported a health care system for all people using government funds.  Long’s authoritarian use of power helped him achieve his goals until his assassination in 1935.

There are four basic health care models

The United States has one of the most expensive health care systems in the world. It invests in research,

However, in 2021, 8.6 percent of the U.S. population was uninsured.  The U.S. is the only country where a substantial portion of the population lacks any form of health insurance. The U.S. has the lowest life expectancy at birth, the highest death rates for avoidable or treatable conditions, the highest maternal and infant mortality, and one of the highest suicide rates in the world. It also has the highest rate of people with multiple chronic conditions and an obesity rate nearly twice the average of other developed countries.

The current programs provided by Medicare (for people over age 65), Medicaid (for people with low incomes), and the Affordable Care Act (current program for most people) are each under attack because of the high costs associated with them and government regulation of the prices paid.

In your research and discussion consider the following models of health insurance and the programs Gov. Huey P. Long implemented in Louisiana in the 1930s.

The Beveridge Model

This model is named after William Beveridge, the social reformer who designed Britain’s National Health Service. In this system, health care is provided and financed by the government through tax payments, just like the police force or the public library.

Many, but not all, hospitals and clinics are owned by the government; some doctors are government employees, but there are also private doctors who collect their fees from the government. This system has the lowest costs per person, because the government controls what doctors can do and what they can charge. Great Britain, Spain, most Scandinavian countries, New Zealand, and Cuba are countries using this model or one that is similar.

The Bismarck Model

The Bismarck models uses an insurance system financed jointly by employers and employees through payroll deduction. Every person is covered. Doctors and hospitals are private operators. Although there are many payers to this model, costs tend to be regulated by the government. Germany, France, Belgium, the Netherlands, Japan, Switzerland, and some Latin American are countries that use this model.

The National Health Insurance Model

This system has elements of both Beveridge and Bismarck models. It uses private-sector providers, but payment comes from a government-run insurance program that every citizen pays into. Costs are considered low because there are no profits, no advertising, and claims are pre-approved. It is a single payer system and as a monopolist it is in a position to negotiate for the lowest prices. This system also has the ability to limit the medical services it will pay for, such as preventive care or what is considered elective procedures. Canada, Taiwan, and South Korea are countries using this model. For Americans over the age of 65, Medicare is similar to this model.

Health insurance is mostly a benefit for industrialized countries. Of the 195 countries on planet Earth, about 40 or 25% have established health care systems. In countries using this model, the poor are neglected.  This is a problem for hundreds of millions of people who have low incomes or are living below the poverty line.

In 2023, the offi­cial pover­ty thresh­old in the United States was $30,900 for a fam­i­ly of two adults and two chil­dren. Fam­i­lies can earn well over this amount and still find they cannot pay all of their bills.

Poverty is relative.  Someone in your class, school, community, etc. will be in the bottom 25% of income earners. An individual earning an hourly wage of $20.00 an hour who works for 35 hours a week earns $700 a week or $36,400 a year. This total is reduced by state and federal taxes and a 7.65% tax on Medicare and Social Security. Although $20 an hour is higher than the minimum wage in every state, it is not considered a living wage.

About one in sev­en (14%) of children under age 16 are in pover­ty in the United States.  This means that about 10 mil­lion kids in 2023 were liv­ing in house­holds that did not have enough resources for basic needs such as food, hous­ing and utilities.  The poverty rate in New Jersey is 10% of the population or about 950,000.  See the SPM child pover­ty rate in your state   The high­est rates of pover­ty gen­er­al­ly occur for the youngest chil­dren — under age 5 — kids in sin­gle-moth­er fam­i­lies, chil­dren of col­or and kids in immi­grant families. The numbers of children and adults living in poverty are increasing and they are a serious problem. The effects of living in poverty are the concern of your discussion as is the most effective way to reduce or eliminate it.

The effects of eco­nom­ic hard­ship dis­rupt the cog­ni­tive devel­op­ment, phys­i­cal and men­tal health, edu­ca­tion­al suc­cess of children. Researchers esti­mate the total U.S. cost of child pover­ty ranges from $500 bil­lion to $1 tril­lion per year based on lost pro­duc­tiv­i­ty and increased health care expenses.

In the United Kingdom, the poverty rate for children is 31% or double the rate in the United States. There is no single, universally accepted definition of poverty for the world.  The United States identifies an income level for family categories and the United Kingdom uses a measure of disposable income (after taxes) below 60% of the median income (income of the largest group in the population) on an annual basis.

For example, the median income in the United States is $40,000. If we used this formula, the poverty level would be $24,000 (after taxes). If we consider a 20% federal tax, 8% FICA and Medicare tax, and a 5% state tax for a person employed in New Jersey making $40,000, their disposable income would be approximately $27,000 or similar to the measure used in the United Kingdom.  If you consider the cost of rent at $2,000 a month, transportation costs at $200 a month, and food at $500 a month for a family or individual in New Jersey, these expenses are $2,700 a month or $32,400 a year. An income threshold of $30,000 a month is not practical.

Dr. Francis Townsend, a medical doctor living in Long Beach, California, introduced a plan in 1933 to provide direct payments to people over the age of 60. The money would be raised through a national sales tax, which in some countries is labeled a Value Added Tax of VAT.

“It is estimated that the population of the age of 60 and above in the United States is somewhere between nine and twelve millions. I suggest that the national government retire all who reach that age on a monthly pension of $200 a month or more, on condition that they spend the money as they get it. This will ensure an even distribution throughout the nation of two or three billions of fresh money each month. Thereby assuring a healthy and brisk state of business, comparable to that we enjoyed during war times.

“Where is the money to come from? More taxes?” Certainly. We have nothing in this world we do not pay taxes to enjoy. But do not overlook the fact that we are already paying a large proportion of the amount required for these pensions in the form of life insurance policies, poor farms, aid societies, insane asylums and prisons. The inmates of the last two mentioned institutions would undoubtedly be greatly lessened when it once became assured that old age meant security from want and care. A sales tax sufficiently high to insure the pensions at a figure adequate to maintain the business of the country in a healthy condition would be the easiest tax in the world to collect, for all would realize that the tax was a provision for their own future, as well as the assurance of good business now.”

Dr. Townsend’s plan became popular with the people and became known as The Townsend Movement.  Although it was criticized by President Franklin Roosevelt, the Social Security Administration is similar to what Dr. Townsend proposed.  He published a newsletter, The Modern Crusader, to promote his plan. The Social Security plan is funded by a tax on incomes because the burden is shared proportionately by different income levels. 

Welfare, unemployment compensation, Medicaid, Medicare, and Social Security are payments to United States’ citizens that are currently being discussed and evaluated. The average monthly payment is slightly less than $2,000. These are direct payments to people from the government, which also benefit local communities as the money is spent on food, housing, and basic needs, and provides a safeguard against bankruptcy and financial hardship. They may also increase the federal debt of a country in times of high unemployment or a pandemic.

Policy makers and economists must also consider public policies regarding the poor and senior citizens. The discussion questions below address the question of poverty for the young, disabled, and elderly and how to finance them.

  1. Do governments have a responsibility to provide financial assistance or a guaranteed living wage to individuals or families with inadequate finances for basic needs?
  2. Are direct income payments a burden on a government or do they provide an efficient return on their investment over time?
  3. Is the question of how to reduce or prevent poverty a matter of taxation or a a matter relating to the priorities of the federal budget?
  4. When people with mortgages apply the cost of interest as a deduction on their income tax, should this be considered an income transfer policy of the government providing assistance to people who are able to own property or their own home?
  5. Should income transfers be made in cash or in-kind benefits such as food stamps, vouchers for health care, etc.?
  6. Should the government regulate the consumption expenses of people receiving income transfers?
  7. Should income transfers be financed by income taxes, consumption taxes, or another method?

https://www.ssa.gov/history/towns5.html (The Townsend Plan)

https://www.ssa.gov/history/towns8.html (Francis Townsend’s Autobiography)

https://socialwelfare.library.vcu.edu/eras/great-depression/townsend-dr-francis/ (Social Welfare History Project)

https://lordslibrary.parliament.uk/child-poverty-statistics-causes-and-the-uks-policy-response/#heading-2 (House of Lords Library)

Presidents and Labor Strikes

Hank Bitten, NJCSS Executive Director

Most decisions by American presidents and other world leaders do not have an immediate impact on the economy, especially regarding the macroeconomic issues of employment and inflation. For example, President Franklin Roosevelt’s bank holiday, President John Kennedy’s tariff on imported steel, and President Ronald Reagan’s Economic Recovery Tax Act had limited immediate effects on the economy, but their long-term effects were significant. The accomplishments or problems of a previous administration may impact on the administration that follows.

For example, President Biden faced criticism about the economy during his administration. The jobs created with the Bipartisan Infrastructure Law and the interest rate policy of the Federal Reserve Bank to lower inflation did not show results until years later. The drop in Real Disposable Income from the administration of President Trump is another example. Real Disposable Income is a measure of income that is adjusted for inflation. The drop between the administration of President Bident and Trump is the result of extended unemployment benefits, people working from home during the pandemic when businesses were closed, and stimulus checks from the government. The economic transition following the end of the pandemic had a significant impact on the economy.

PresidentGDP GrowthUnemployment  RateInflation RatePoverty RateReal  Disposable  Income
Johnson2.6%3.4%4.4%12.8%$17,181
Nixon2.0%5.5%10.9%12.0%$19,621
Ford2.8%7.5%5.2%11.9%$20,780
Carter4.6%7.4%11.8%13.0%$21,891
Reagan2.1%5.4%4.7%13.1%$27,080
H.W. Bush0.7%7.3%3.3%14.5%$27,990
Clinton0.3%4.2%3.7%11.3%$34,216
G.W. Bush-1.2%7.8%0.0%13.2%$37,814
Obama1.0%4.7%2.5%14.0%$42,914
Trump2.6%6.4%1.4%11.9%$48,286
Biden2.6%3.5%5.0%12.8%$46,682

This series provides a context of important decisions by America’s presidents that are connected to the expected economic decisions under the second administration of President Trump. The background information and questions provide an opportunity for small and large group discussions, structured debate, and additional investigation and research. They may be used for current events, as a substitute lesson activity or integrated into a lesson.

In the case study below, have your students investigate the economic problem, different perspectives on the proposed solution, the short- and long-term impact of the decision, and how the decision affects Americans in the 21st century.

The Economic Problem

One of the first labor strikes in the United States occurred in Paterson, New Jersey on July 3, 1835.  About 2,000 textile workers stopped working in about 20 textile mills demanding better hours. Workers, including women and children worked 13 hours a day six days a week and their wages were reduced as fines for infractions. The strike eventually led to a 12-hour day and a nine-hour day on Saturday.

In 1835 carpenters, masons, and stonecutters in Boston staged a seven-month strike in favor of a ten-hour day. The strikers demanded that employers reduce excessively long hours worked in the summer and spread them throughout the year. In Philadelphia, carpenters, bricklayers, plasterers, masons, leather dressers, and blacksmiths went on strike. In Lowell, MA, women also went on strike. The history of labor complaints and strikes date back to the colony of Jamestown. Although the common law in England provided protection for peaceful demonstrations, the courts in the colonies and states often fined workers because their organization as a group was viewed as a ‘restrain of free trade’ or a violation of the right of property for employers. In 1842, the Commonwealth of Massachusetts v. Hunt was a landmark decision that allowed peaceful demonstrations. “In March 1842, Chief Justice Lemuel Shaw ruled that labor combinations were legal provided that they were organized for a legal purpose and used legal means to achieve their goals.”

The economic problem was long hours, low wages, and oppressive working conditions. The market revolution led to the demand for consumer goods. The new inventions of the cotton gin, steamboats, locomotives, and factories. The nature of work was changing and this led to profound changes in society. Employers and entrepreneurs believed this was the idea behind the pursuit of happiness in the declaration of Independence and how a republic was governed. Laborers used the press to voice their concerns which led to the organization of trade unions in Philadelphia.

President Andrew Jackson’s decision to let the charter of the Second Bank of the United States to expire had an unexpected and profound impact on ordinary people. Working conditions continued to decline and President Jackson’s decision led to an increase in paper money and inflation. Higher prices led to unemployment and longer hours for those who were employed. Illness or injury and debt led to homelessness and poverty. According to a New York City physician, the laboring poor in the 1790s lived in “little decayed wooden huts” inhabited by several families, dismal abodes set on muddy alleys and permeated by the stench from “putrefying excrement.” Source

In 1840 the federal government introduced a ten-hour workday on public works projects. In 1847 New Hampshire became the first state to adopt a ten-hour day law. It was followed by Pennsylvania in 1848. Both states’ laws, however, included a clause that allowed workers to voluntarily agree to work more than a ten-hour day. Despite the limitations of these state laws, agitation for a ten-hour day did result in a reduction in the average number of hours worked, to approximately 11 by 1850.  On May 19, 1869, President Grant issue Proclamation 182 making an 8-hour day for all federal government employees. This expanded the decision of Congress made in 1868.

After the Civil War, manufacturing and economic growth increased dramatically. There were many strikes as farmers and laborers, both skilled and unskilled, formed associations and unions. Below are examples of larger strikes that are likely part of the high school curriculum.

During the first week of May,1886 workers in Chicago staged demonstrations and strikes demanding an eight-hour day. On May 4 a bomb exploded near Haymarket Square in Chicago.  Several police officers and protesters were wounded or killed by the blast, and 8 individuals were arrested and convicted. Source

A day to recognize the rights of workers was first proposed by Matthew Maguire from Paterson, NJ in 1882. The balance between the right to have peaceful demonstrations under the First Amendment was respected but the Haymarket Riot became violent, strikes were costly to the profits of employers, and violence and strikes were a threat to property. President Cleveland was the first president challenged by the threat of anarchy from socialists. After the Haymarket Riot, a few states, including New York and New Jersey, recognized a Labor Day holiday. This was the fourth federal holiday after Independence Day, Christmas Day, and New Year’s Day. Congress considered making Labor Day a federal holiday in May, but President Cleveland feared this would become a recognition of the violence of the Haymarket Riot.  President Cleveland was the first president to involve the federal government in resolving issues between labor and business interests or capital.  Source

Newspaper Accounts of the Haymarket Riot, 1886

  1. Under what conditions would you support workers on strike? (higher wages, better working conditions, unfair practices by an employer, benefits, job security, etc.)
  2. Are labor strikes a violation of the property rights of employers?
  3. Do workers have a right to disrupt the production of goods or services by a slowdown in the workplace, strict adherence to their contract agreement, coordinating a sick out, making public expressions or statements about their situation, etc.
  4. Do workers need to be paid in wages or can employers also pay them in other ways? (time off, goods produced, etc.)
  5. Should workers receive an annual salary increase based on their months or years of service, inflationary costs of living, or only if they produce more than in the past?
  6. How would you determine a fair wage?
  7. Do the students in your class (or a larger group) support the right to strike workers?

Open the three-day lesson on the 1835 strike in Paterson, NJ. (Update the CPI index from 2012 to the present)

In the months before the presidential election of 1892, President Harrison was faced with a violent strike at the Carnegie Steel Company in Homestead, PA near Pittsburg. The Knights of Labor and the Amalgamated Association of Iron Workers went on strike on June 30 when their contract expired. Workers in Carnegie’s companies in the area supported the striking workers.  Henry Clay, the manager of the Homestead plant, hired private Pinkerton guards to protect the plant and keep the striking workers away. President Harrison privately sent Whitelaw Reid to mediate the conflict.

The strikers threw rocks at the guards, the crowd size was estimated to be about 5,000, and gunshots were fired. At one point amid the chaos, shots were fired. The Pinkertons surrendered and the strikers continued with verbal abuse and assaulted them with rocks as they marched them to a local Opera Hall.

On July 12, Pennsylvania Governor Robert Pattison sent 8,500 National Guardsmen to end the strike. In less than 30 minutes the Carnegie mill was under martial law, the strikers were arrested. Sixteen of the strikers were arrested for conspiracy, murder, and inciting riots. The strike ended three months later in November with the workers agreeing to lower wages, the elimination of 500 jobs, and a 12-hour day. The labor unions lost, and their membership declined.

President Cleveland faced a nationwide railroad strike that began on May 11, 1894. The American Railway Union went on strike against the Pullman Company and the major railroads.  It became a turning point in U.S. labor law. The workers at Pullman protested the layoff of 2,000 workers and wage cuts that amounted to 25%-50% of their wages. The Pullman workers lived in a company town and paid rent to the Pullman Company, which was located near Chicago, Il. The rents were not reduced. The Pullman Company also had a surplus of $4 million at the time of the strike and consistently paid dividends to shareholders.

The Panic or recession of 1893 negatively affected many companies as production declined. The railroads depended on shipping farm products, which were reduced as a result of crop failures. This was the most serious economic recession in the world as investors in Europe purchased gold from U.S. banks, Americans took their savings out of banks, and companies that had speculated in the stock, bond, and commodity markets lost money/ The economic recovery after the recession ended would take several years.

On July 3, 1894, President Cleveland ordered 2,000 armed federal troops to Chicago to end the strike. The strike ended within a few weeks, union leaders were arrested and jailed on charges of conspiracy to obstruct interstate commerce. The justification of using federal troops to move the U.S. mail was based on the Sherman Anti-Trust Act of 1890. This was not the first time federal troops were used to end a strike. President Jackson used troops in 1834 to end the strike by workers building the Chesapeake and Ohio Canal and in 1877 President Hayes send troops to end the violence in Baltimore during the Great Railroad strike.

In May 1902 President Teddy Roosevelt was faced with a nationwide strike by coal miners. Many homes were heated by coal and a prolonged strike in the winter could be catastrophic, deadly, and cause riots. On October 3, 1902, with winter weather approaching, President Theodore Roosevelt called a precedent-shattering meeting to negotiate a settlement. The President did not have any legal authority to settle a labor dispute, although Presidents Jackson, Hayes and Cleveland used federal troops to end labor disputes.

President Roosevelt’s administration proposed the Anthracite Coal Commission to complete a fact-finding report and negotiate a settlement.  The strike ended on October 20, 1902, and the Commission recommended in March 1903 increasing miners’ pay by ten percent (one-half of their demand) and reducing the working day from ten to nine hours.

Samuel Gompers wrote: “Several times I have been asked what in my opinion was the most important single incident in the labor movement in the United States and I have invariably replied: the strike of the anthracite miners in Pennsylvania … from then on the miners became not merely human machines to produce coal but men and citizens…. The strike was evidence of the effectiveness of trade unions ….

The victory in the anthracite coalfields breathed new life into the American labor movement.55 It strengthened moderate labor leaders and progressive businessmen who championed negotiations as a way to labor peace. It enhanced the reputation of President Theodore Roosevelt. Sometimes overlooked, however, is the change the conflict made in the role of the Federal Government in important national strikes.” Source

The silk strike began in February 1913 when twenty-five thousand striking silk workers shut down the three hundred silk mills and dye houses in Paterson, New Jersey, for almost five months. There were several textile strikes that preceded the one in Paterson. The Paterson strike was related to an increased workload and the desire for an eight-hour day. The other strikes occurred because of wages. The Industrial Workers of the World (I.W.W.) were active in organizing the strike and produced the “Pageant of the Paterson Strike” in Madison Square Garden on June 7.  Pietro Botton opened his home to the labor leaders from New York City and on May 25, a rally of more than 20,000 people took place outside his home. These rallies continued on Sundays until the strike ended in July.

The strikers returned to work without any concessions, although the employers did not implement the plan to have one worker operating four looms instead of two.

  1. What is a yellow dog contract, scab, collective bargaining, closed shop, and right to work protections
  2. What are the differences between skilled and unskilled laborers?
  3. How is an Association different from a labor or trade union?
  4. Who has the advantage in a strike: labor employees or employers?
  5. How do strikes affect the economy and the lives of people who are not associated with the union?
  6. Why do you think the union and workers failed to achieve their goal in the Paterson Strike of 1913?
  1. Make a list of labor unions and associations in the United States.
  2. Use these sources to categorize the list of strikes by length of time, size of the unions, and frequency? List of Unions (Wikipedia)   200 Years of Labor History (NPS)

The Seattle General Strike of February 1919 was the first 20th-century solidarity strike in the United States to be proclaimed a “general strike.”  Seattle had 101 unions that were part of the American Federation of Labor (AFL). On the morning of February 6, 1919, over 25,000 union workers stopped working to support the 35,000 shipyard workers who were already on strike. Although wartime inflation created a need for higher wages, the goals of the striking workers were not clearly articulated. Mayor Ole threatened to declare martial law and two battalions (about 3,000) U.S. Army troops arrived. The union members had already implemented a plan to provide food deliveries, transport people to hospitals, and patrol the streets to prevent crime. Below is an image of a soup kitchen. Union members distributed 30,000 meals a day during the strike.

The strike lasted six days and was peaceful. There were minimal gains for the workers, but most returned to work. There were several outside agitators who were identified as “Reds” or communists who were arrested. The strike is generally viewed as unsuccessful.

Seattle General Strike Project

History of the General Strike (9-minute Video)

History of the General Strike (4-minute Video)

The Seattle General Strike (Roberta Gold) 

“An Account of What Happened in Seattle and Especially in the Seattle Labor Movement, During the General Strike, February 6 to 11, 1919” 

Slide show 

The Seattle General Strike 

The Boston Police went on strike on September 9, 1919. Police officers worked long hours, received low wages, and had inadequate working conditions. They worked thirteen-hour days and wanted an eight-hour day. They had to purchase their own uniforms which cost $200 (about two months’ salary), were required to sleep overnight in the police station several nights a month, and they had not received a salary increase in over ten years. They were paid about 25 cents an hour and earned about $1,400 a year.

The three cases below were landmark decisions in the labor movement. The Lochner decision ruled that employers could issue contracts without any restrictions such as an 8- or 10-hour day. The Adkins decision supported this and ruled it was illegal to have a minimum wage for workers. The Muller decision ruled that the hours of women could be less than those of men if their health was at risk.

The general right to make a contract in relation to one’s business is part of the liberty protected by the Fourteenth Amendment, and this includes the right to purchase and sell labor, except as controlled by the state in the legitimate exercise of its police power.

The regulation of the working hours of women falls within the police power of the state, and a statute directed exclusively to such regulation does not conflict with the Due Process or Equal Protection Clauses.

Legislation fixing hours or conditions of work may properly take into account the physical differences between men and women, but the doctrine that women of mature age require (or may be subjected to) restrictions on their liberty of contract that could not lawfully be imposed on men in similar circumstances must be rejected.

Frances Perkins was asked to serve as FDR’s Secretary of Labor. As Secretary, she would pursue: a 40-hour work week; a minimum wage; unemployment compensation; worker’s compensation; abolition of child labor; direct federal aid to the states for unemployment relief; Social Security; a revitalized federal employment service; and universal health insurance. She is the longest serving labor secretary and one of only two cabinet secretaries to serve the entire length of the Roosevelt Presidency.

The Wagner Act (1935) created the National Labor Relations Board to enforce employee rights rather than to mediate disputes. It gave employees the right, under Section 7, to form and join unions, and it obligated employers to bargain collectively with unions selected by a majority of the employees in an appropriate bargaining unit. 

The U.S. Supreme Court in NLRB v. Washington Aluminum in 1962 upheld the right of employees to go on strike whether they have a union or not. However, workers and unions still needed to be careful to avoid an unlawful strike.

A strike is likely protected by law if it is in response to “unfair labor practice strikers” or “economic hardship from low wages, excessive hours, or difficult working conditions.” 

A strike may be unlawful when it supports an unfair labor practice such as requiring an employer to stop doing business with another company. Workers cannot legally strike if their contract prohibits strikes, although workers can stop working if they are subject to dangerous or unhealthy conditions.

After World War II, there were several major strikes and unions were unpopular because of the strikes and fear of the expansion of communism after Churchills’ Iron Curtain speech. The Taft Hartley Act amended the Wagner Act (1935). It was proposed by Rep. Fred Hartley from New Jersey and Senator Robert Taft from Ohio.  The Taft-Hartley Act made major changes to the Wagner Act. It was vetoed by President Truman and required a vote by both houses of Congress to override his veto. The Act was amended to protect employees’ rights from unfair practices by unions by making the closed shop and wildcat strikes to be illegal and prohibiting unions from charging excessive fees for membership.

  1. What are the differences between a walkout, lockout, strike, and sit-down strike? Do the definitions or labels matter if work stops?
  2. Should certain employees be prevented from having a union to represent their interests?
  3. Should certain employees who serve the public be prevented by law from being able to strike when the public’s safety or interest is at risk? (teachers, bankers, police, sanitation, transportation workers, nurses, etc.)
  4. What is arbitration, fact-finding, and collective bargaining? What is the purpose of each?
  5. What is back pay?  Should striking workers be compensated for the days or weeks they did not work?
  1. Interview two or three people or groups of people regarding labor conditions they would like to have negotiated in their favor.
  2. Review the contract between teachers and the Board of Education in your district or another district. Discuss the protections in the contract that are not directly related to salary?

In January 1966, there was a 13-day transit strike in New York City. The buses and trains were shut down. In 1968, the teachers and sanitation workers went on strike. Thousands of New York City teachers went on strike in 1968 when the local school board of Ocean Hill – Brownsville, fired nineteen teachers and administrators without notice. The newly created school district, in a heavily black neighborhood, was an experiment in community control over schools—those dismissed were almost all Jewish. The strike began in September and ended on November 17. There are many important issues relevant to this strike – civil rights, integrated schools, poor performing districts, and local control vs. a central Board of Education. The strike raised the issue if public sector employees (police, fire, teachers, and private sector employees should have the right to strike over unfair business practices.

On the morning of August 5, 1981, approximately 13,000 workers of the air traffic control facilities called a strike.  President Reagan spoke from the Rose Garden at the White House telling them to return to work within 48 hours or be fired. About 2,000 returned to work and the rest were fired. The government used people from the military and retired air traffic controllers to monitor the flights and hired new air traffic controllers. This one event had a proof und effect on the labor movement as workers feared losing their jobs if they went on strike.

The 232-day baseball strike of 1994-95 was the biggest one in professional sports. Although there have been many work stoppages in professional baseball dating back to 1912, the study of this strike is important because of the challenges it presented to labor negotiators. This problem has historical origins and dates back to the Sherman Antitrust Act of 1890. In 1922, the U.S. Supreme Court ruled that professional baseball was exempt from the anti-trust protection because it was not considered to meet the definition of trade or commerce. Federal Baseball Club of Baltimore, Inc. v. National League of Professional Baseball Clubs et al.  The case was appealed several times but not reversed. The only option for players was to strike. Source

The strike began on August 12, 1994, and the World Series was cancelled on September 14. One of the main issues was the salary cap that owners placed on the players. The cancellation of the World Series prompted some senators to propose legislation to end the anti-trust exemption given to baseball. This divided the Congress because the protection was favored by owners of smaller teams. President Clinton attempted to intervene but was not able to negotiate a settlement. As the 1995 baseball season was about to begin, baseball owners planned to hire non-union replacement players, a tactic used by the National Football League in 1987. On March 31, 1995, U.S. District Judge Sonia Sotomayor issued an injunction, and the baseball players returned to the field.

Chronological History of Labor Strikes in the United States (NPS

President Bill Clinton – Public Vaccinations

Most decisions by American presidents and other world leaders do not have an immediate impact on the economy, especially regarding the macroeconomic issues of employment and inflation. For example, President Franklin Roosevelt’s bank holiday, President John Kennedy’s tariff on imported steel, and President Ronald Reagan’s Economic Recovery Tax Act had limited immediate effects on the economy, but their long-term effects were significant. The accomplishments or problems of a previous administration may impact on the administration that follows.

For example, President Biden faced criticism about the economy during his administration. The jobs created with the Bipartisan Infrastructure Law and the interest rate policy of the Federal Reserve Bank to lower inflation did not show results until years later. The drop in Real Disposable Income from the administration of President Trump is another example. Real Disposable Income is a measure of income that is adjusted for inflation. The drop between the administration of President Bident and Trump is the result of extended unemployment benefits, people working from home during the pandemic when businesses were closed, and stimulus checks from the government. The economic transition following the end of the pandemic had a significant impact on the economy.

PresidentGDP GrowthUnemployment  RateInflation RatePoverty RateReal  Disposable  Income
Johnson2.6%3.4%4.4%12.8%$17,181
Nixon2.0%5.5%10.9%12.0%$19,621
Ford2.8%7.5%5.2%11.9%$20,780
Carter4.6%7.4%11.8%13.0%$21,891
Reagan2.1%5.4%4.7%13.1%$27,080
H.W. Bush0.7%7.3%3.3%14.5%$27,990
Clinton0.3%4.2%3.7%11.3%$34,216
G.W. Bush-1.2%7.8%0.0%13.2%$37,814
Obama1.0%4.7%2.5%14.0%$42,914
Trump2.6%6.4%1.4%11.9%$48,286
Biden2.6%3.5%5.0%12.8%$46,682

This series provides a context of important decisions by America’s presidents that are connected to the expected economic decisions under the second administration of President Trump. The background information and questions provide an opportunity for small and large group discussions, structured debate, and additional investigation and research. They may be used for current events, as a substitute lesson activity or integrated into a lesson. 

In the case study below, have your students investigate the economic problem, different perspectives on the proposed solution, the short- and long-term impact of the decision, and how the decision affects Americans in the 21st century.

Public health decisions in the United States have historically been determined by states. (Tenth Amendment) Massachusetts is the first state to require that children have a smallpox vaccine before going to school to prevent the spread of smallpox in schools. Children in the United States receive immunizations through both private and public providers. The federal government has supported childhood immunization since 1963 through the Vaccination Assistance Act. Since 1994, the Vaccines for Children (VFC) program has provided additional support for childhood vaccines. In 2002, 41% of childhood vaccines were purchased by the federal government through VFC and 43% through the private sector. Thirty states have vaccine requirements for students going to college. See the list of vaccines required for K-12 schools on page 8 of the Center for Disease Control document: CDC Document

Adult immunization is primarily performed in the private sector. Since 1981, Medicare has reimbursed the cost of pneumococcal vaccine for its beneficiaries; influenza vaccine was added in 1993. The cost of vaccinations has increased significantly in the past 20 years.

The greatest fear in the 19th and 20th century was the spread of unknown or viral diseases. Major epidemics in the United States are cholera, flu, polio, HIV/AIDS, SARS, H1N1, and Covid-19. Vaccines were developed for smallpox and rabies. The virus, poliomyelitis, was a highly contagious disease with symptoms including common flu-like symptoms such as sore throat, fever, tiredness, headache, a stiff neck and stomach ache. Polio also affected the brain and spinal cord, which could lead to paralysis and also death. President Franklin Roosevelt was infected with poliomyelitis in 1921. The disease first emerged in the United States in 1894, but the first large epidemic happened in 1916 when public health experts recorded 27,000 cases and 6,000 deaths—roughly a third in New York City..

Epidemics are costly in the loss of human lives, medical and hospital costs, and absence from school and work. Because preventive health measures and vaccines save money, they are considered by economists as a public good. For example, the average billing costs for non-complex Covid-19 hospitalizations averaged between $31,000 and $111,000. Complex cases with hospitalizations averaged between $132,000 and $472,000. The average hospital cost in New Jersey for Covid-19 in 2020 was $377,198. Source

There were 6 million Americans hospitalized in 2020 with Covid-19. If we estimate the average hospitalization cost at $100,000, the cost of the epidemic would be around $60 billion. If we estimated the cost a5 $50,000, the cost would be $30 billion. The cost to the government in providing vaccines for free in 2020 was $25.3 billion. According to the National Institutes of health, the U.S. government purchased 1.2 billion doses from Pfizer and Modern at a price of $20.69 peer dose. Source. A total of $53.6 million was appropriated in 1956-57 for the polio vaccine.

Analyze the information in the image below to discuss if public health programs are best administered by the states or the federal government.

  1. If the cost of a vaccine is $20.69, should the government pay for free vaccines for the general public or encourage people to get vaccinated at their own expense?
  2. Should the cost of vaccinations be the responsibility of private health insurance for people not covered by Medicare?
  3. Is public health a burden that should be shared by government, individuals, and health insurance companies?
  4. To protect the public from an epidemic or the flu, measles, pneumonia, etc. should the government rely on the approximately 40,000 private centers of medical offices and retail pharmacies to distribute and administer the vaccine or use the approximately 6,000 public health clinics and hospitals? Which distribution strategy is the most effective and why?
  5. Should the government encourage masks, hand washing, and other methods to prevent the spread of an epidemic instead of free or subsidized vaccinations?
  1. Invite the school nurse, doctor, and or representative from a health insurance company to your class to discuss the costs and benefits of vaccinations to contain the spread of epidemics.
  2. Research the policies on immunizations and vaccinations by other countries (Japan, Britain, Denmark, Mexico, Canada) Mandatory Vaccinations: The International Landscape   Mandatory Childhood Vaccinations
  3. Meet with your Math teacher to analyze the hypothetical costs of hospitalizations, preventive health care, and productivity costs for staying home from work.

Vaccines against contagious infectious diseases have strong spillover effects, since immunization protects not just those being immunized but others as well. Since the benefits extend beyond those individuals who choose to get vaccinated, the public benefits of vaccines are larger than the individual benefits.  However, the price of the vaccine (i.e. $20) only benefits the person who paid for it out of pocket. The benefit to the public or larger society is the result when a significant majority is vaccinated and protected.

Economists evaluate the costs and benefits. For example, the government could subsidize the cost by 25% or 50%. The government (state or federal) could provide an incentive and pay individuals to get vaccinated or offer a tax credit or deduction. Public health strategies might include charging less than the market price for vaccines, paying individuals to immunize, or making immunization compulsory. The government can also mandate vaccinations by law.

The economic problem becomes more complex when we consider that some health issues like cancer, tetanus, or diabetes are not contagious. Also, vaccines for HIV/AIDS and Human Papillomavirus (HPV) benefit specific populations. The Public Health Service act of 1972 provided grants to state and local governments for immunizations and vaccine purchases. President Clinton’s administration in 1994 launched the VFC (Vaccines for Children) These provided funds to support schools requiring immunizations, with allowances for religious or moral exemptions.

View the image below from the Center for Disease Control (CDC) and validate its accuracy, bias, or misinformation.

  1. Interview your school’s administration regarding the policy for vaccinations for students, teachers, and staff.
  2. Research the vaccination policy at state and private colleges in your area.
  3. Meet with a travel agent or use the source from Wikipedia regarding vaccination requirements from countries.  Source  If the United States discontinues its financial support for vaccinations will this have an impact on Americans travelling to other countries?

Questions:

  1. What is the most effective way to protect public heatlh?
  2. Are the benefits of free or subsidized vaccinations greater than the costs of hospitalization and loss of life?
  3. Should federal programs also include subsidies for preventive health such as mammograms, colonoscopies, blood pressure screening, etc.
  4. Public education is paid for by taxpayers and through money raised by state governments.  Should public health follow a similar model or is it different?
  5. Are the economic benefits of government funded vaccinations more important than the scientific evidence or the fact that they may not be effective for everyone and in some cases result in death?

President Ronald Reagan and the Economic Recovery Tax Act (Social Security)

Most decisions by American presidents and other world leaders do not have an immediate impact on the economy, especially regarding the macroeconomic issues of employment and inflation. For example, President Franklin Roosevelt’s bank holiday, President John Kennedy’s tariff on imported steel, and President Ronald Reagan’s Economic Recovery Tax Act had limited immediate effects on the economy, but their long-term effects were significant. The accomplishments or problems of a previous administration may impact on the administration that follows.

For example, President Biden faced criticism about the economy during his administration. The jobs created with the Bipartisan Infrastructure Law and the interest rate policy of the Federal Reserve Bank to lower inflation did not show results until years later. The drop in Real Disposable Income from the administration of President Trump is another example. Real Disposable Income is a measure of income that is adjusted for inflation. The drop between the administration of President Bident and Trump is the result of extended unemployment benefits, people working from home during the pandemic when businesses were closed, and stimulus checks from the government. The economic transition following the end of the pandemic had a significant impact on the economy.

PresidentGDP GrowthUnemployment RateInflation RatePoverty RateReal Disposable Income
Johnson2.6%3.4%4.4%12.8%$17,181
Nixon2.0%5.5%10.9%12.0%$19,621
Ford2.8%7.5%5.2%11.9%$20,780
Carter4.6%7.4%11.8%13.0%$21,891
Reagan2.1%5.4%4.7%13.1%$27,080
H.W. Bush0.7%7.3%3.3%14.5%$27,990
Clinton0.3%4.2%3.7%11.3%$34,216
G.W. Bush-1.2%7.8%0.0%13.2%$37,814
Obama1.0%4.7%2.5%14.0%$42,914
Trump2.6%6.4%1.4%11.9%$48,286
Biden2.6%3.5%5.0%12.8%$46,682

This series provides a context of important decisions by America’s presidents that are connected to the expected economic decisions facing our current president’s administration. The background information and questions provide an opportunity for small and large group discussions, structured debate, and additional investigation and research. They may be used for current events, as a substitute lesson activity or integrated into a lesson.

In the case study below, have your students investigate the economic problem, different perspectives on the proposed solution, the short- and long-term impact of the decision, and how the decision affects Americans in the 21st century.

President Roosevelt introduced Social Security as a transfer payment to workers who would retire at age 65 with a life expectancy of 70 years in 1940. The income of workers was taxed, and Social Security was generously funded by workers. Today, there are only two workers contributing to Social Security for every retiree receiving a monthly check. It is considered a transfer payment because the money received is spent locally on basic needs and part of the amount is taxed.

President Johnson expanded Social Security to include Medicare and Medicaid. President Reagan began taxing the benefits received, raised the retirement age to 67, and allowed for contributions from payrolls to Individual Retirement Accounts. President Trump raised the age from 70 ½ to 73 ½ regarding required minimum withdrawals from private retirement accounts.

Retirement is a relatively new concept in economic history. Social Security began in 1935, and American presidents have made significant changes to it, especially in the last 50 years. Defined pension plans were offered to employees in the first half of the 20th century but became too expensive for most corporations.  Today, many public service workers, teachers, police, fire) have defined pensions and receive a monthly distribution. Without monthly Social Security payments, it would be difficult for retired individuals to live above the poverty line.

The evolution of Individual Retirement Accounts began with President Gerald Ford in 1976, and presidents have made changes to it over the past 50 years. Most American workers have an IRA, which may be called a 401(k), 403(b), Roth or something else. Today there is $40 trillion invested in mutual funds and U.S. securities in IRA accounts of Americans. In this case study, you will analyze the economic importance of this money, which is about equal to the national debt of the United States government. Today, about 40% of American households have an IRA account. Most of the remaining 60% will depend on Social Security, personal savings and assets, or fall into poverty.

  1. How does having approximately 8% of your paycheck withheld for Social Security and Medicare affect the economy, stock market, and the quality of family life?
  2. How do other countries provide support for their retirees?  Is it valid to compare a large country (USA) with a smaller country with a higher ranking (Denmark)?     Source
  3. If you were an economic advisor to our current president, what reforms regarding Social Security and retirement income would you suggest?
  4. What risks do current and future retirees face in the short term (next five years)?
  5. Are the options for investing in retirement accounts reasonable, too risky, or too limited?

Report on the Economic Well-Being of U.S. Households in 2023-2024

Statement on Signing the Retirement Equity Act of 1984

  1. Use the table below to calculate the taxes that the average worker in the United States who owns a home pays in state and federal taxes.
ItemPercent of Taxes$100,000 Example$200,000 Example
Federal Income Taxes12%, 22%, 24%, 32%, 35%, 37%Use 12% or 22%Use 24%
State Income Taxes (NJ)3.5%, 5.5%,Use 3.5%Use 5.5%
FICA Tax with Medicare7.65%Use 7.65%Use 7.65%
Local Property Tax on a $400,000 property (varies)10%, 15%Use 10%Use 15%
Sales Tax (7% of spending)Calculate as 2% of incomeUse 2%Use 3%
NJ SUI Taxes1%Use 1%Use 1%
Total36.15% to 55.15%  
  • Compare these tax rates to those in a European country or Canada.
  • Find the average cost of what a family pays for medical insurance as a percentage of their income.
  • Deduct expenses for housing (rent or mortgage), food, vacation, medical, transportation, and savings (10%). How much is left?

The Industrial Revolution sparked the first true need for retirement. Assembly lines and factories demanded constant energy from their workers. Pensions began in the 1800s for older workers to help keep productivity up. But during the Great Depression, older workers didn’t want to leave their jobs — and their paychecks — behind. In turn, FDR designed the Social Security Act, effectively birthing the Social Security program so that older Americans could retire financially. The act is the Federal Insurance Contributions Act (FICA) and was signed in 1935 but didn’t begin payouts until 1940. In 1939, Social Security was expanded to include women. When Social Security became law, workers contributed one percent of their income.  Today, they contribute 6.2% and an additional 1.45% for Medicare. Employers match these contributions for a total of 15.3%.

As part of the “War on Poverty,” President Johnson signed the Social Security Act of 1965, which enacted Medicare and Medicaid under the Social Security Administration. In 2018, over 52 million people age 65 and older used Medicare for health insurance.

While President Reagan lowered income taxes, he was the first to make it possible to be taxed on your Social Security benefits in retirement, depending on how much you make. He also raised the full retirement age so that anyone born after 1960 would have to wait until age 67 to receive full benefits. The IRS under the Reagan administration also made it possible to have deductions taken out of employees’ salaries to contribute directly to their 401(k)s — something many workers rely on today.

President Clinton created another level of Social Security taxation, allowing up to 85% taxable benefits depending on how much you make. At the same time, he got rid of the retirement earnings test and prevented the Social Security Administration from blocking retirees from benefits based on earnings.

In 1990, the Older Workers Benefit Protection Act required employers to provide the same benefits for workers over age 65 as younger employees.

In the Unemployment Compensation Amendments of 1992, the rollover rules we know today were implemented. These new rules allowed women who often job-hop to keep their tax-qualified assets protected until retirement.

1993 ushered in the Family and Medical Leave Act (FMLA). This became one of the most important job protections for women after giving birth or providing care for a family member. Now, she could come back to her job and not lose her pay rate.

Although, some consider Social Security as an entitlement, it can be changed by Congress. When workers pay into Social Security, they are contributing to a trust fund instead of a personal account.

Because the combined OASI and DI Trust Funds have accumulated assets of over $2.5 trillion, the excess of program cost over current tax income will be covered by net redemption of these assets in the coming years. It is only when the reserves in the trust funds are exhausted that timely payment of full scheduled benefits becomes an issue. As shown in the chart, at the time of projected trust fund exhaustion in 2037, continuing tax revenue is expected to be sufficient to cover 76 percent of the currently scheduled benefits.

  1. Does the Social Security treat women fairly or equally with men? Do you recommend any reforms?
  2. Should Social Security benefits be taxed or tax free?
  3. What will happen to Social Security benefits when the trust fund has insufficient funds?

Treatment of Women in the Social Security System

Senior Citizens’ Freedom to Work Act

  1. Research the impact of a decision by Congress to make Social Security benefits tax free. Research the impact this will have on the trust fund.
  2. How does full employment and a sustained period of high unemployment above 7% affect Social Security and Medicare.
  3. Calculate the amount of money a worker earning $100,000 pays into Medicare over a period of 40 years and the average costs of what Medicare pays for each person today. Medicare Spending and Finance
  4. How have recent reforms under President Biden affected Medicare spending?
  5. Discuss the impact of reduced Social Security benefits for people when the trust fund is depleted, around 2033.

When a person receives their monthly Social Security check it is most likely deposited directly into their bank account. This allows it to earn interest immediately and to be used for expenses. Look at the Circular Flow of Money diagram below to see how government money is transferred to households and distributed through the local economy.

For example, whether a person receives a Social Security check for $1,000 or $5,000 some of the money goes to banks (financial institutions) and is used for loans to businesses, homeowners, students, etc., to purchase government bonds to support government spending (including Social Security), and for the bank to pay taxes, its employees, and operational costs. Since part of Social Security income is taxable, the federal government receives some of the money back in taxes. Perhaps the most important influence Social Security has on the economy is that people spend the money locally in supermarkets, stores, and restaurants and it saves the government money by keeping people self-sufficient and out of poverty.  This is how money circulates in the economy and creates income for businesses, local and state governments, doctors, and others.

Money also has a Multiplier Effect. The diagram below illustrates the effect of one dollar. As each dollar enters the economy through the purchase of a bagel or donut, the local store expects that sales will continue to increase. As a result, they hire an additional worker, produce more bagels or donuts, and perhaps they will open a second store. As people buy more bagels and donuts, the store needs more flour, butter, cream cheese, coffee cups, etc. The newly hired employee also receives a paycheck for their work and spends it in the community. Basically, think of money multiplying ten times. For each $1.00 spent, the multiplier effect is that it circulated to different people ten times. If the effect of $1.00 is the spending of $10.00 over a month, imagine the impact of a $1,000 Social Security check ($10,000) or a $5,000 Social Security check.

  1. To what extent do government transfer payments (i.e., Social Security) pay for themselves?
  2. What would be the economic effect on the economy if people at the age of 67 did not receive an incentive (Social Security) to retire?
  3. Should people be allowed not to participate in Social Security as an employee?
  4. If Social Security was discontinued, would the effect on the economy be positive or negative?
  1.  Calculate different scenarios if a person should collect their Social Security at age 62, 67, or 70. The scenarios should include individuals who are single, married, in excellent health, divorced, collecting benefits while still working, and for a spouse who did not work and make FICA contributions for the required ten years. Benefit Calculator

According to the Investment Company Institute, “there are more than 710,000 plans, on behalf of about 70 million active participants and millions of former employees and retirees. Savings rolled over from 401(k)s and other employer-sponsored retirement plans also account for about half of the $13.6 trillion held in individual retirement account (IRA) assets as of December 31, 2023.” https://www.ici.org/401k ($13.6 trillion is approximately 1/3 of the federal debt)

The IRA, originally offered strictly through banks, become instantly popular, garnering contributions of $1.4 billion in the first year (1975).  Contributions continued to rise steadily, amounting to $4.8 billion by 1981.

The Economic Recovery Tax Act (ERTA) of 1981 allowed for the IRA to become universally available as a savings incentive to all workers under age 70 1/2.  At that time, the annual contribution limit was also increased to $2,000 or 100% of compensation.

With the passage of the Tax Reform Act of 1986, income restrictions were introduced, limiting the availability of deductible contributions to the TIRA for individuals with incomes below $35,000 (single) or $50,000 when covered by an employer plan.  In addition, provision was made for the Spousal IRA, wherein the non-working spouse could make contributions to a TIRA from the working spouse’s income. 

1996’s Small Business Job Protection Act saw the implementation of the Savings Incentive Match Plan for Employees (SIMPLE IRA), which provided for employer matching and contributions to the employee plans, a viable alternative in many cases to the 401(k), although with more restrictive contribution limits. 

With the Taxpayer Relief Act of 1997, the Roth IRA was introduced.  In addition, phase-out limits were increased, plus the distinction was added for limits on deductible contributions if the taxpayer was covered by an employer-provided retirement plan. The Education IRA was also introduced, with features similar to the Roth IRA (non-deductible but tax-free upon qualified distribution).

In 2001 the Economic Growth and Tax Relief Reconciliation Act (EGTRRA), increased contribution limits with a “catch-up” provision for taxpayers aged 50 and older. An additional provision was the option to convert funds from a Traditional IRA to a Roth IRA, regardless of income level. 

The Consolidated Appropriations Act of 2016 finally made Qualified Charitable Distributions (QCDs) permanent. This feature applies to individuals age 70½ or older and subject to Required Minimum Distributions. The Qualified Charitable Distribution allows direct distributions to charitable organizations (houses of worship, non-profit organizations, etc.) from their IRAs without having to include the amount of the distribution in gross income for the tax year. In 2019, the age for Required Minimum Distributions was changed to age 73½.

As of the most recent reports from 2021, the Investment Company Institute indicates 37% of all American households own an IRA account of some type (over 48 million households). Approximately 27.3 million households have a Roth IRA, holding roughly $1.3 trillion in assets, while traditional IRA are owned by 36.6 million households, holding approximately $11.8 trillion.

Questions:

  1. How will the taxes paid by retirees on their IRA distributions affect the federal budget and national economy?
  2. How does the flow of money from current workers contributing to their Individual Retirement Accounts affect investment firms and the stock market?
  3. Should Social Security and Individual Retirement account changes be allowed or should changes only apply to people who are working and not retired?
  4. Should anyone not participating in the labor force because they are caring for someone in their home be allowed to contribute to Social Security or an Individual Retirement Account?
  5. Should money in an IRA account be allowed to be deposited in a traditional bank savings account of CD that is insured by the Federal Deposit Insurance Corporation?
  6. Should Individual Retirement Accounts replace Social Security for anyone who has not started paying FICA taxes?

President Richard Nixon – Price Controls and Ending the Gold Standard

Most decisions by American presidents and other world leaders do not have an immediate impact on the economy, regarding the macroeconomics of employment and inflation, at least in the short term of their administration. For example, President Franklin Roosevelt’s bank holiday, President John Kennedy’s tariff on imported steel, and President Ronald Reagan’s Economic Recovery Tax Act had limited immediate effects on the economy but their long-term effects are significant. The accomplishments or problems of the previous administration will likely impact the administration that follows. For example, President Biden faced criticism about the economy in his administration but the steps taken to address them may not show results until years later. The drop in Real Disposable Income from the administration of President Trump is significant because it measures income after taxes and inflation.

PresidentGDP GrowthUnemployment RateInflation RatePoverty RateReal Disposable Income
Johnson2.6%3.4%4.4%12.8%$17,181
Nixon2.0%5.5%10.9%12.0%$19,621
Ford2.8%7.5%5.2%11.9%$20,780
Carter4.6%7.4%11.8%13.0%$21,891
Reagan2.1%5.4%4.7%13.1%$27,080
H.W. Bush0.7%7.3%3.3%14.5%$27,990
Clinton0.3%4.2%3.7%11.3%$34,216
G.W. Bush-1.2%7.8%0.0%13.2%$37,814
Obama1.0%4.7%2.5%14.0%$42,914
Trump2.6%6.4%1.4%11.9%$48,286
Biden2.6%3.5%5.0%12.8%$46,682

This series provides a context of important decisions by America’s presidents that are connected to the expected economic decisions facing our current president’s administration. The background information and questions provide an opportunity for small and large group discussions, structured debate, and additional investigation and research. They may be used for current events, as a substitute lesson activity or integrated into a lesson.

In the case study below, have your students investigate the economic problem, different perspectives on the proposed solution, the short and long term impact of the decision, and how the decision affects Americans in the 21st century.

  1. The world’s economy collapsed as a result of World War I. The Bretton Woods Agreement provided stability with a fixed exchange rate of $35 U.S. dollars to an ounce of gold. The strength of the U.S. dollar and economy was good for the United States and other countries. In fact, the gold of most countries was at the Federal Reserve Bank in New York, so it was easy to physically move gold from one vault to another. The Marshall Plan provided $13.3 billion (about $175 billion in today’s money) to rebuild Europe. The Bretton Woods Agreement supported a global economy and international trade and cooperation.
  • By 1960, the U.S. economy began facing new challenges from the Baby Boomers, national debt, Cold War, trade deficit, higher unemployment and inflation. Economists introduced new research on the economy. The ideas of John Maynard Keynes that were seen as helpful to the challenges of the Great Depression and World War II were questioned in the 1960s by Milton Friedman and Paul Samuelson and other economists who carefully followed the money supply in the economy. In response to the cost of the Vietnam War and the Great Society programs, in addition to the increased consumption of the Baby Boomers, the interest rate policy of the Federal Reserve Bank supported an increase in dollars.
  • President Richard Nixon understood the political implications of the U.S. economy. Although an inflation rate of 4.7% may not appear to be a concern, it is an increase of 50% from the expected rate of 3% and a GDP growth rate of 2%. When President Nixon became president ever nation wanted dollars. The amount of dollars in circulation increased to four times the amount of gold in reserves. As aa result the dollar was overvalued and very strong. This situation negatively impacted our balance of trade with other countries. In 1971, the United States reported its first trade deficit.
  • As the supply of dollars increased over the quantity of gold, the United States Treasury feared that countries might ask for their gold and the United States would not be able to meet their demands. As inflation increases, the purchasing power of the dollar decreases. A simple solution would be to devalue the dollar but since it was pegged to gold at $35 an ounce, this was not possible. The situation became critical in 1971when Britain requested selling $3 billion dollars it had from a trade surplus for gold. The United States only had about $10 billion in gold and if other countries asked for gold, there would be an international crisis.

Examine the graph below for the years 1950-1970. Calculate the percent decline in the purchasing power of the dollar.  How does a weaker dollar affect trade and the national economy?  What are the advantages and disadvantages of a stronger and weaker dollar?

Examine the data in this chart, especially for the years, 1960-1980. The amount of gold reserves (left axis) is constant but the value of the dollar changes. Which events in the 1960s likely affected the weakening of the U.S. dollar? Which decisions or events in the 1970’s contributed to the noticeable decline in the dollar. How does a weaker dollar affect the economy differently for consumers and investors?

President Lyndon Johnson responded to the ‘small’ (18%) decrease in the value of the dollar in 1968 with a temporary (one-year) surcharge of 10% on income tax payments. The purpose of the additional tax was to reduce or stabilize the 3.0 percent rate of inflation. Even with the surcharge, inflation increased to 4.7% within the year. On August 25, 1969, the federal funds rate was at 9.75%, the highest level since World War 2, about seven percent above the GDP growth rate, and will cause an economic recession. The economic advisors, including Arthur Burns, Chairman of the Federal Reserve Bank, informed Nixon that the traditional monetary and fiscal policy tools were not working, President Nixon extended the tax surcharge through 1970. With the presidential election in 1972, Nixon knew that he needed to control the rising rate of inflation and avoid causing a recession.

President Nixon called for a secret meeting at Camp David to address this problem. He knew that politically the need to make a bold decision, like FDR with the decision to close the banks in March 1933. He also wisely sought the perspectives of economists with different points of view.

On August 15, 1971, President Nixon addressed the nation from the Oval Office with his historic decision, Executive Order 11615:

  1. Wage and price controls for 90 days
  2. Ending the Bretton Woods Agreement on converting dollars to gold
  3. 10% surcharge tax on tariffs

The Fed Funds rate in August 1971 was at 5.75% about three percent higher than the GDP rate of growth. One of the objectives of the “Nixon Shock” was to force other countries, especially China, to revalue their currencies to allow for a competitive free trade market for the United States. The stock market jumped 4% on August 16, but the decision to allow gold to be bought and sold at the market would lead to an unexpected increase in the price of oil. The wage and price controls and tariff surcharge were lifted by the end of 1971 but making the U.S. dollar the reserve currency of the world had lasting implications for the economy. President Nixon won the 1972 election by a landslide but the negative effects of then Nixon Shock would return in 1973.

Invite students to interview senior citizens who will have different perspectives as investors, bankers, union workers, homeowners, etc. on the “Nixon Shock.” For example, I was a high school teacher in New York City earning $5,500 a year. Prices were high from inflation and I was looking forward to a 20% salary increase, about $1,000, on September 1, 1971. My 1969-70 salary was frozen as was the pay scale for another year.  In 1973, the price of gasoline increased from 39 cents a gallon to more than 60 cents and gas was rationed. Although the energy crisis was the result of an embargo by OPEC against the United States for our support of Israel in the Yom Kippur War. After the embargo was lifted the higher cost of energy continued contributing to unemployment and continuing inflation. This became known as stagflation.

History of the Gold Standard

Gather information about the new technologies of how credit cards, money markets, and currency swaps increased personal spending, consumption, and the velocity of money.

  1. How did the banking industry change to ‘create’ new money in the economy?

In the chart below, currency represents coins and dollars, what we call cash.

M1 money represents currency plus money in a checking account which can quickly be exchanged for cash.

M2 money represents money that requires going to the bank tor waiting more than one month to convert the money to cash. (i.e. certificate of deposit)

  • Calculate the slope of the graph in dollars and also by the annual percentage change.
  • How did this contribute to inequality, consumer debt, and inflation?
  • What is the difference between installment credit and revolving credit?
  • How did the credit card change our standard of living?
  • What were the consequences of higher unemployment and full employment?
  • How did two income households affect the supply of money?

The Evolution of Consumer Credit in America

  1. What information is provided in the graph?
  2. What are several reasons for an increase in productivity by workers?
  3. How can high school students become more productive in their social studies class? (i.e. better grades, complete additional assignments and projects)
  4. Should a worker be paid on the amount of work they produce or on the wage they agreed to when they were hired? Should a teacher be paid based on the output (grades) of the students in their classes?
  5. Why do the red and blue lines diverge after 1970? Why is there a significant gap between what workers are producing in one hour and what they are paid?

The immediate impact of separating the value of the dollar from a fixed exchange rate of $35 was that the new value increased by 10% to $38 an ounce. It took about four years for the global economy to stabilize and accept dollars as the reserve currency (or safety net) in the event of a crisis. The supply of gold increased significantly after 1971 with about half of the current supply of gold being mined since the ‘Nixon Shock’.

  1. How do countries buy dollars? How does this affect our economy?

Source:

  • Is it possible for foreign countries to have too many U.S. dollars?
  • How would the decision of other countries to adopt a different currency affect the economy of the United States?
  • If a group of countries made a secret agreement to sell their U.S. dollars in a short period of time and purchase euros or the renminbi instead, how would the United States economy be affected?
  • What is the future of the dollar as the reserve currency? Does the United States have more advantages than disadvantages of being the dominant economic power in the world? The Dollar: The World’s Reserve Currency

President Bill Clinton – Tariffs and Free Trade Agreements

Most decisions by American presidents and other world leaders do not have an immediate impact on the economy, regarding the macroeconomics of employment and inflation, at least in the short term of their administration. For example, President Franklin Roosevelt’s bank holiday, President John Kennedy’s tariff on imported steel, and President Ronald Reagan’s Economic Recovery Tax Act had limited immediate effects on the economy, but their long-term effects are significant. The accomplishments or problems of the previous administration will likely impact the administration that follows. For example, President Biden faced criticism about the economy in his administration, but the steps taken to address them may not show results until years later. The drop in Real Disposable Income from the administration of President Trump is significant because it measures income after taxes and inflation.

PresidentGDP GrowthUnemployment RateInflation RatePoverty RateReal Disposable Income
Johnson2.6%3.4%4.4%12.8%$17,181
Nixon2.0%5.5%10.9%12.0%$19,621
Ford2.8%7.5%5.2%11.9%$20,780
Carter4.6%7.4%11.8%13.0%$21,891
Reagan2.1%5.4%4.7%13.1%$27,080
H.W. Bush0.7%7.3%3.3%14.5%$27,990
Clinton0.3%4.2%3.7%11.3%$34,216
G.W. Bush-1.2%7.8%0.0%13.2%$37,814
Obama1.0%4.7%2.5%14.0%$42,914
Trump2.6%6.4%1.4%11.9%$48,286
Biden2.6%3.5%5.0%12.8%$46,682

This series provides a context of important decisions by America’s presidents that are connected to the expected economic decisions facing our current president’s administration. The background information and questions provide an opportunity for small and large group discussions, structured debate, and additional investigation and research. They may be used for current events, as a substitute lesson activity or integrated into a lesson.

In the case study below, have your students investigate the economic problem, different perspectives on the proposed solution, the short- and long-term impact of the decision, and how the decision affects Americans in the 21st century.

Students in your class are likely familiar with mercantilism and its benefits to the “mother country” or “home country”. 18th century mercantilism utilized the resources and cheaper labor of colonies or other places to the benefit of one country. Adam Smith challenged the benefits of mercantilism and advocated laissez-faire economics, the balance of supply and demand, and open markets. Smith believed that mercantilism was a self-defeating system that limited economic growth and national wealth. He argued that a free-market system and free trade would produce true national wealth. 

However, political leaders may not agree (or understand) economic theories or how economic systems work. In Washington’s administration, Secretary of the treasury, Alexander Hamilton argued for a tariff. His Report on Manufacturers argued for the protection of the new manufacturing sector of the United States (Paterson and the Great Falls) and having a tariff to raise revenue for the federal government. Hamilton compromised on his tariff plan and the Tariff Act of 1789 was only 5%.

Henry Clay’s American System supported tariffs to protect our economic growth from foreign imports. His speech in 1824 was the first attempt to make America self-sufficient and independent of other countries. In 1828, Congress passed the Tariff of Abominations which led South Carolina to pass the Nullification Act.  The Tariff of 1828 set a 38% tax on some imported goods and a 45% tax on certain imported raw materials.

  1. How was the American System designed to work?
  2. What impact did the American System have on the U.S. economy during the early to mid-1800s?
  3. Did the American System benefit each region equally or did some regions have an advantage?
  4. How did the American System set the stage for the Industrial Revolution and sectionalism?
  5. What lessons should have been learned from the Tariff of 1828?

In the chart below, use the data beginning in 1800 with the Per Capita Income (per person) set at 200. This number indicates that the per person income from 1700 to 1800 doubled. Next, examine the indicator in 1850, which is set at 220. This indicates that the per person income increased only 20% in the fifty years since 1800. This is less than one-half percent per year on average.

Next, compare the date on tariff rates in the graph above with the per capita income rates in the graph below. Do tariffs impact economic growth?

At the beginning of the 19th century, the United States was a rural and agricultural country. Our nation’s population was small compared to Britain and France and scattered over a large area. Our population was 5.3 million in 1800, compared to Britain’s 15 million and France’s 27 million. Tariffs from Britain and France were high and significantly made the price of imported goods in the United states high.

After the War of 1812, the American economy began to grow. The development of steamboats, canals, railroads and the telegraph reduced costs and made communications faster. The growth of cities created markets for industrial goods. New inventions increased agricultural production and textile manufactures.  Children, immigrants, and women provided affordable labor.  Source

Discuss and debate the role of the federal government in the economy.

Do tariffs support or restrict economic growth?

Does free trade support or restrict economic growth?

Why do you think Britain lowered tariffs after 1828 and France did not?

Is economic growth dependent on the age, health, and skills of the labor force?

Is economic growth dependent on the infrastructure of a country to facilitate the distribution of goods and services?

How can governments best distribute wealth equally in the economy?

Do national leaders have any significant influence on economic growth?

How did the stock and commodities markets provide money (capital) for economic growth?

After the Civil War, the United States experienced unprecedented economic growth with the Industrial Revolution, imperialism, and immigration. The use of greenbacks and silver provided capital, cities provided markets for stores, immigrants provided affordable labor, and new technologies increased productivity and the efficient distribution of goods and services.

The beginning of a market exchange for bonds, agricultural products, and stocks developed with the Buttonwood Agreement in Manhattan. Stockbrokers and merchants met under the Buttonwood tree to sign an agreement that established the foundation for the New York Stock Exchange. The building with the flag is the Tontine Coffee House, where stocks were eventually traded.

The Mohawk & Hudson Railroad Company was the first railroad stock listed on the NYSE in 1830. At that time, the Exchange was called the New York Stock & Exchange Board. Banks and steel foundries were also listed. Mercantile exchanges for agricultural products provided guidance on the future demand for wheat, rice, tobacco, cotton and other products. These investments supported economic growth more than the protectionism of tariffs.

The flow of international capital into the United States provided capital for the Industrial Revolution that followed the Civil War. The market cap/GDP ratio tripled from around 15% in the 1860s to 50% by 1900. The inflation in the United States that occurred after World War I, World War II and the Vietnam War reduced the relationship of the market cap/GDP ratio and slowed the rate of economic growth. After each of these inflationary cycles, a return to higher tariffs to limit cheaper imports from other countries was the solution proposed by political leaders.  Economists, Joseph Schumpeter, Friedrich Hayek, John Maynard Keynes and Milton Friedman advocated for lower tariffs, innovation, and entrepreneurs to promote economic growth. The ratification of the 16th amendment and the adoption of the income tax in the United States undermined the argument that tariffs were necessary to fund the government and to protect industries from foreign competition.

President Hoover signed the Smoot-Hawley Tariff Act in 1930 raising the tariff by an average of 20% to protect American farmers from the effects of the stock market crash. The tariff caused trade between Europe and the U.S. to decline by two-thirds. At the end of World War II, tariffs were decreased substantially, and the U.S. supported the establishment of the World Trade Organization, which has sought to promote the reduction of tariff barriers to world trade.

  1. Does the public or private sector have the greater influence on economic growth and stabilizing inflation?
  2. What can be done to limit the effects of business cycles leading to inflation and unemployment?
  3. How effective are tariffs, embargoes, and sanctions in getting leaders of countries to negotiate or change their policies to align with the interests of the United States?
  4. Under what circumstances might tariffs be justified or effective?
  5. Examine the graph below to determine the biggest employer in the United States.
  • What conclusions can you make about the largest private employers in each state from the map below?

RWJBarnabas Health is the largest private employer in New Jersey, with 31,683 employees. Healthcare is a major employer in the state, accounting for 16% of all jobs. Who is the largest private employer in your county?

Use the chart below to compare the change in prices for an automobile before and after a hypothetical tariff of 20%. Because automobiles have thousands of parts and assembling an automobile often occurs in different countries, a tariff has the greatest impact on new cars.

Interview a local car dealer in your community about how a tariff will affect their business and how they plan to respond with sales, rebates, reduced financing, layoffs of workers, etc. Also ask about how a tariff will affect parts, tires, and the repair or maintenance of automobiles.

Make a list of five or more other businesses in your community that import supplies from other countries. (phones, Dollar Stores, coffee, clothing, TV monitors, etc.) If possible, research or interview the manager of a local big box store (Walgreens, Target) about how a tariff will affect their business.

Create a graphic design or flow chart to illustrate how the effect of higher prices from tariffs will affect consumer spending. For example, if prices increase by 20% and salaries increase by 5%, how will this affect businesses and households? Higher prices from tariffs are considered inflationary and layoffs from reduced sales are considered recessionary. Discuss what the short-term impact (three years) will be on the economy and your family.

In 1951, six countries (France, Germany, Italy, Belgium, Netherlands, and Luxembourg) agreed to sell coal and steel to each other without tariffs. The European Coal and Steel Community (ECSC) established a single common market. In 1957, the European Economic Community (ECC) was created by the Treaty of Rome. The six countries that formed the European Coal and Steel Community agreed to trade additional goods without tariffs, to work together on nuclear power plants for energy, and to form a parliament. In 1992 the Maastricht Treaty was signed by 12 countries leading to the European Union and a common currency, the euro, in 1999. The euro was fully implemented by 2002.

President Clinton’s administration signed the North American Free Trade agreement with Mexico and Canada in 1993 (it became effective on January 1, 1994) removing tariffs between these countries. The Transatlantic Trade and Investment Partnership (T-TIP) is a trade and investment agreement currently being negotiated between the United States and the European Union. This agreement will allow American families, workers, businesses, farmers and ranchers through increased access to European markets for Made-in-America goods and services.

In 2020, the Conservative Party in Britain convinced the people to leave the European Union (Brexit).  The United Kingdom was the second-largest economy in Europe, its third-most populous country, and one of the largest contributors to the budget of the European union.  In January 2024, an independent report by Cambridge Econometrics claimed there were two million fewer jobs, and the prices of essential goods were higher. As a result of Brexit, the average citizen (per person) lost about 2,000 pounds and someone living in London about 3,400 pounds as a result of leaving the common market.

It is difficult to assess the impact of NAFTA on the United States because of currency value fluctuations, trade with China, the impact of technology, the relocation of some corporations, and the values placed on agricultural products.  The Center for Economic and Policy Research estimated in 2014 a decline from a surplus of $1.7 billion to a deficit of $54 billion. The data in the graphs below suggest a positive trade balance with Canada and Mexico over the past 30 years. (1994-2022) Mexico, Canada, and China are the three major trading partners with the United States.

In the graph below there is a slight increase in exports from the United States to Mexico and exports with Canada continue at 15%. Exports to China had a significant drop of about one-third.

Data Reflecting the new USMCA ratified in 2019.

Maple syrup, pine lumber, and cranberries are a few items in our homes that are likely imported from Canada under NAFTA or the new USMCA. Lululemon and Blackberry are brands from Canada. Appliances, automobiles, tomatoes, avocados, electronics, monitors are some items from Mexico.

Identify items in your home with labels from Mexico and Canada, interview merchants in supermarkets and department stores, and conduct research to identify the importance of trade between the United States, Canada, and Mexico.

Develop a position statement or a short paper explaining your opinion on tariffs and free trade agreements to stimulate economic growth and stabilize inflation.