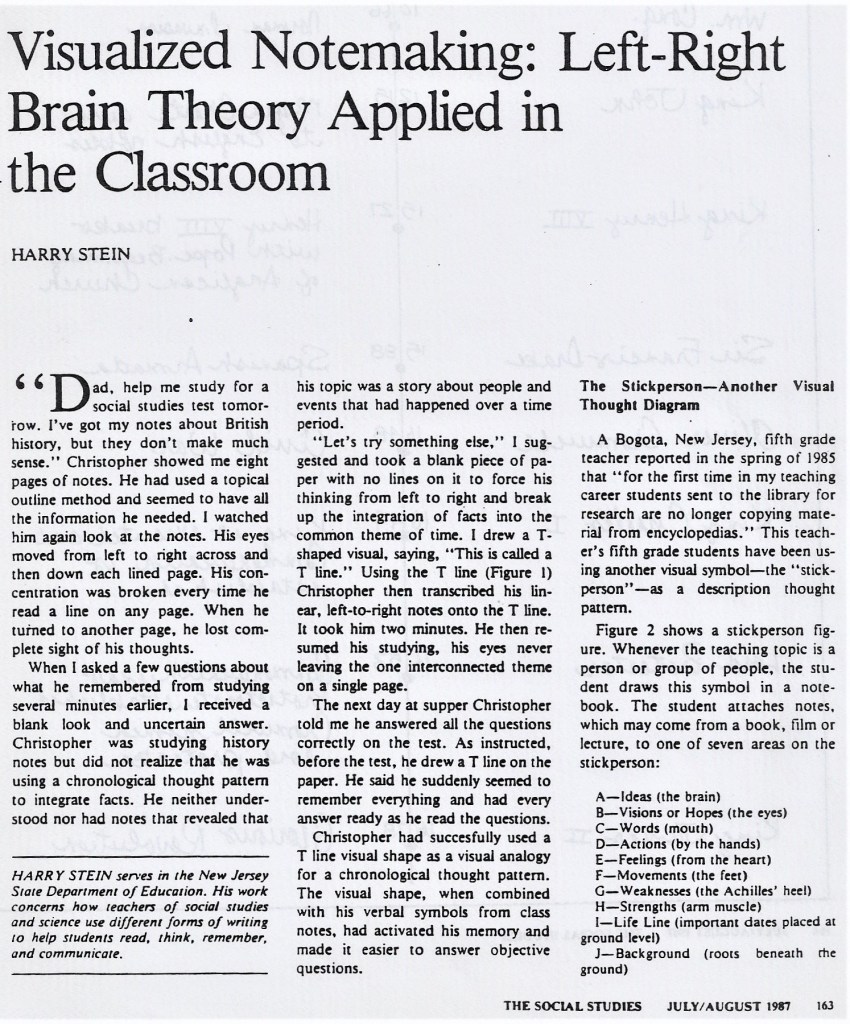
Gathering & Organizing Information
Dr. Harry Stein, Manhattan College
Reading
Illustration #1 (Gathering & Organizing) shows an Academic Literacy flow chart.

Inputs are depicted in the upper left. Reading is one means whereby students practice Gathering and Organizing. It is the first input which leads to processing, storage, and then producing thought.
First, we must describe and define the term “reading.”
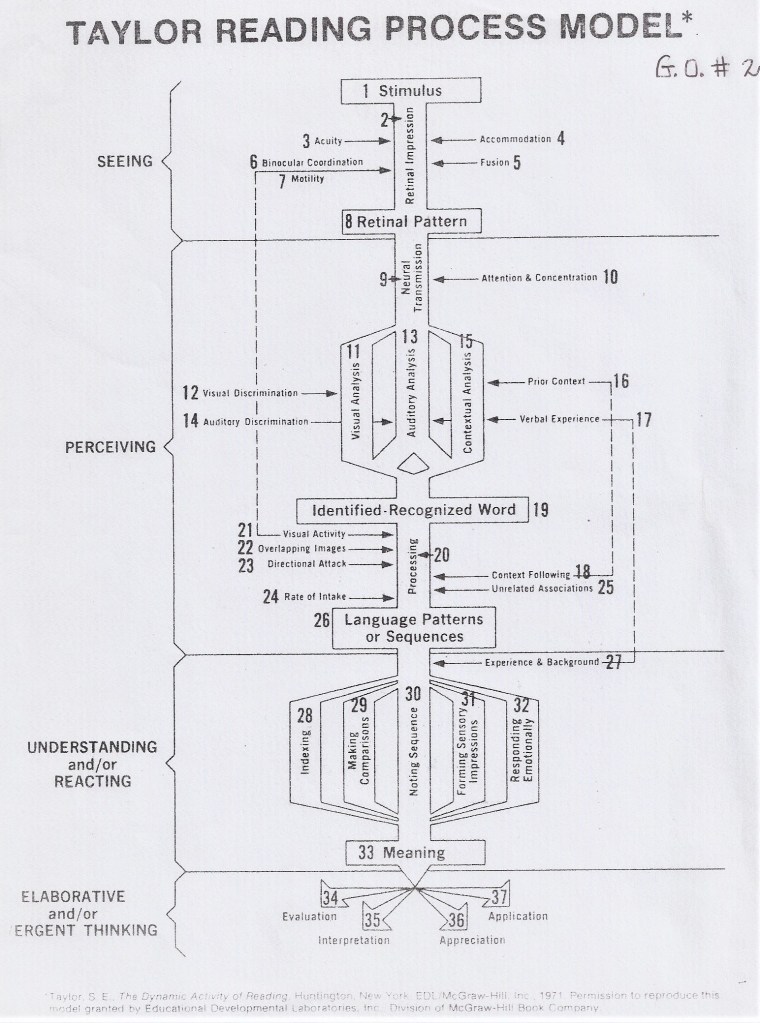
Academic Literacy is used in knowledge-based classes with content teachers. They are never reading teachers and do not teach reading. They use reading for academic content goals. Academic literacy begins at #27 on the Taylor model. If students can not progress through points #1-26 they must receive direct reading instruction from reading teachers. Their comprehension level must be 4th grade or higher. Academic literacy gives content teachers the tools to create content learning after students can decode words and minimally comprehend. Academic literacy is a teaching/learning concept in departmentalized middle and high schools. It assumes minimal reading skills, #1-26 and proceeds from #27 to #37 on the Taylor model.
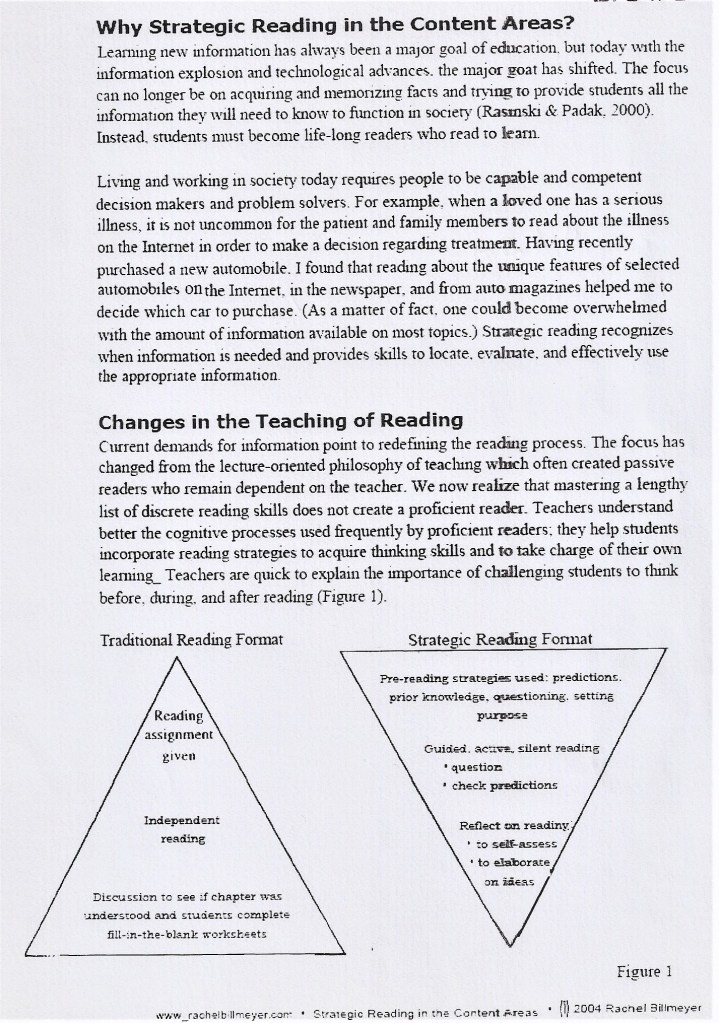
Academic Literacy reading is strategic reading. Reading is a tool for achieving content learning. Illustration #3 describes strategic reading in the content areas. It differentiates between traditional reading activities and strategic reading. The former assumes students can read, retain, and discuss after an assignment. The latter is planned and directive.
In Social Studies reading occurs in three settings: the classroom, the independent assignment, and within tests.
The acronym CAT defines these settings: class, assignment, and test.
Classroom Reading—The short passage
Find a critical, short reading passage. Refer students to their text or handout. “Short” means no more than three or four reading minutes. Attention research indicates that the student focus span rarely exceeds four minutes. The content must be absolutely critical for meeting our goals.
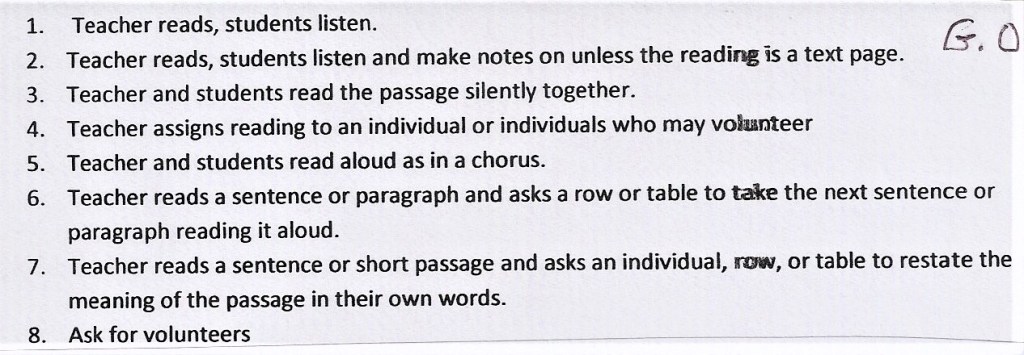
So, how can we start the reading? Illustration #4 gives us eight ways. Set a purpose for the reading. Tell students what they will do after the reading. Then, begin the short “tight” reading.
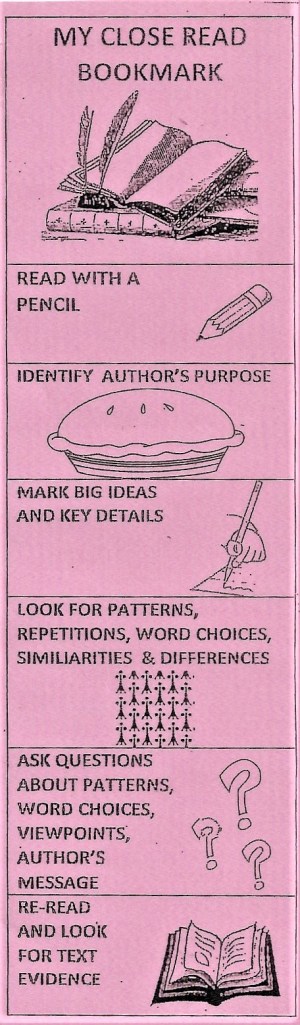
Mary Byatt and Laura DiPetro of Washington Township in New Jersey created a tool they call My Close Read Bookmark. Give one to each student, Illustration #5.
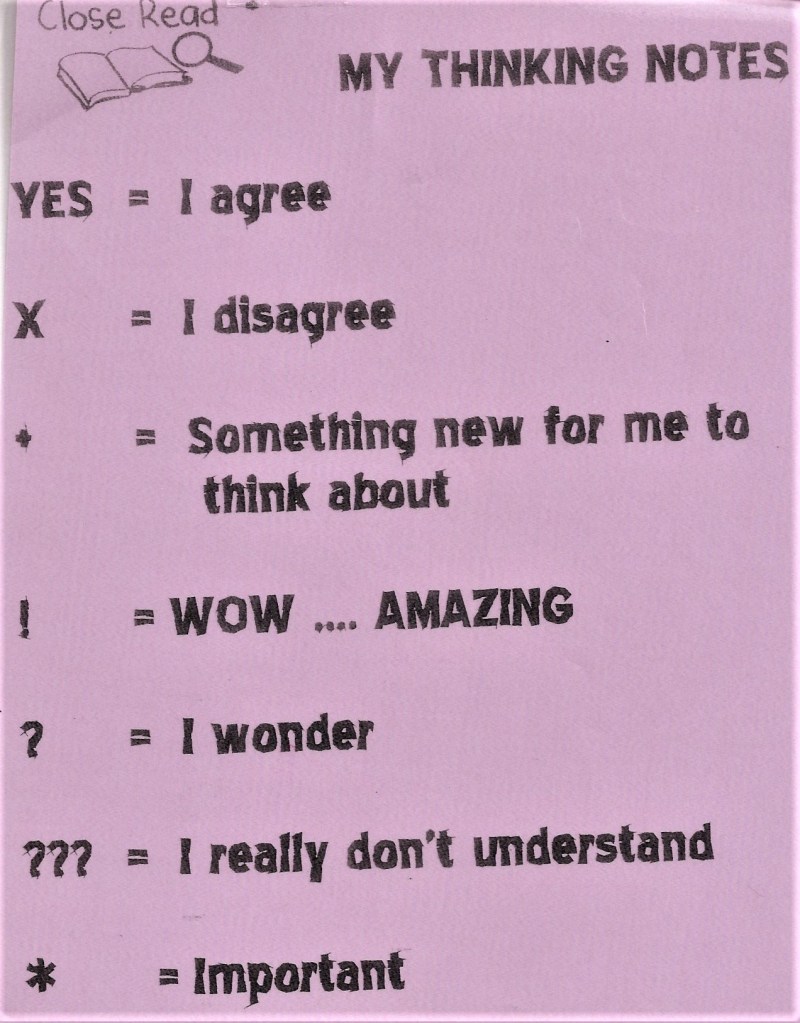
Using this tool they make “thinking notes.” Illustration #6
Before class ask students to bring in a 4 color pen. Use black for important notes, red for confusing ideas, blue for clear ideas, and green for post-reading review notes. Green for growth or change.
For memory ask students to note the weather that day, the type of clothing they wore, what they ate for breakfast or lunch or any other personal marker of their lives that day. Personal memory and academic reading memory unite.
Classroom Reading—The primary source document.
Faculty at Knox College in Iowa use Illustration #7 when examining documents. Students make notes on the handout.

At a 2015 U.S. History AP Reading Conference, Christopher Lewis and Jennifer Yoo Brannon, both AP teachers, presented another tool they called the HAPPY Analysis Chart. Illustration #8. When reading/discussing the document the chart is a note-making tool. H-A-P–P sections are indicated. The Y is for “why” is the document significant.

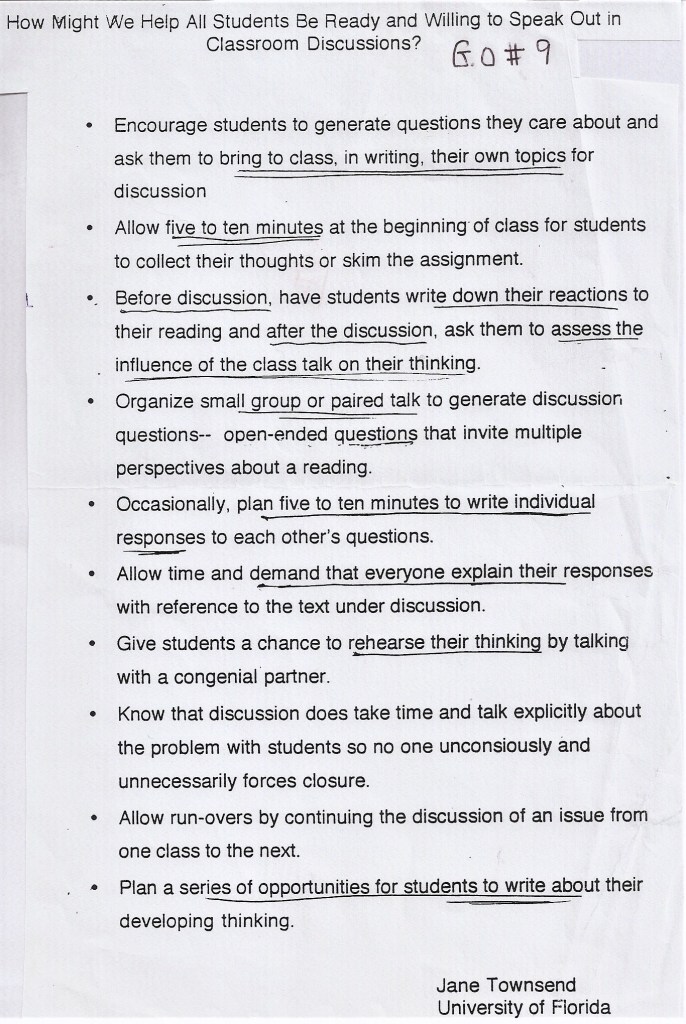
Classroom Reading QUESTION/DISCUSSION STRATEGY. Jane Townsend, University of Florida Illustration #9 gives us general guidelines for in-class readings.
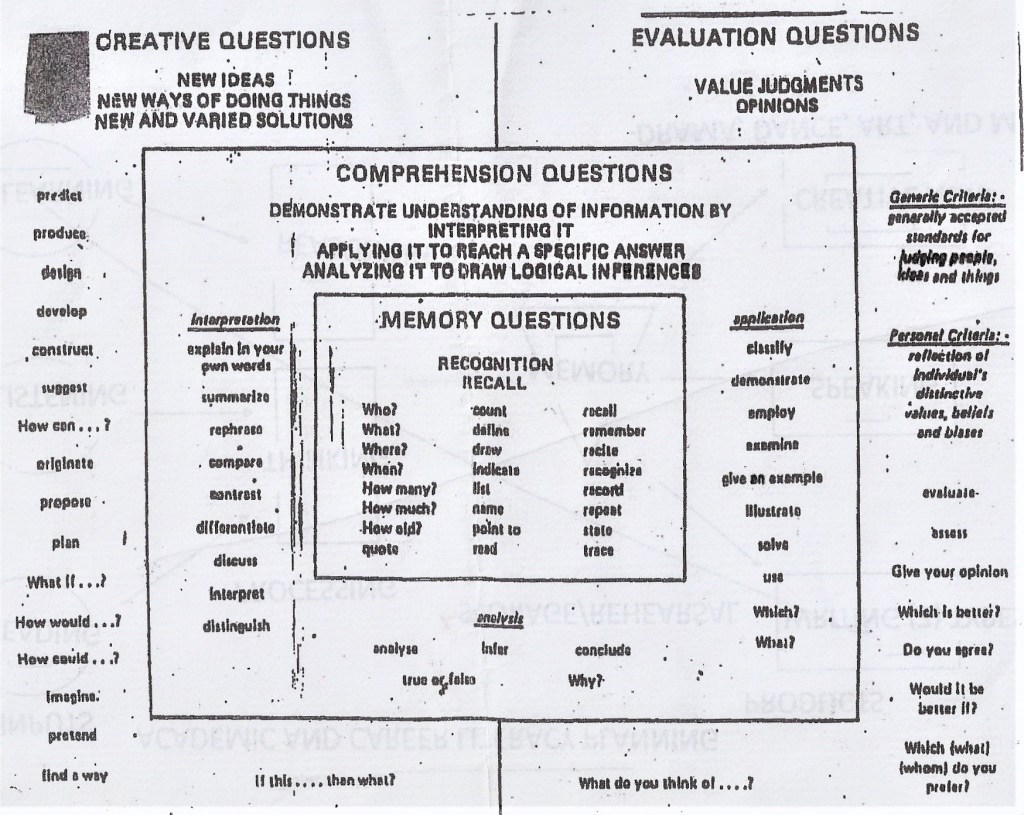
Every classroom reading needs a question strategy the teacher shares with the readers. Illustration #10 visualizes 4 types of thinking skills and the question triggers for each.
Illustration#11 shows the QARS strategy.
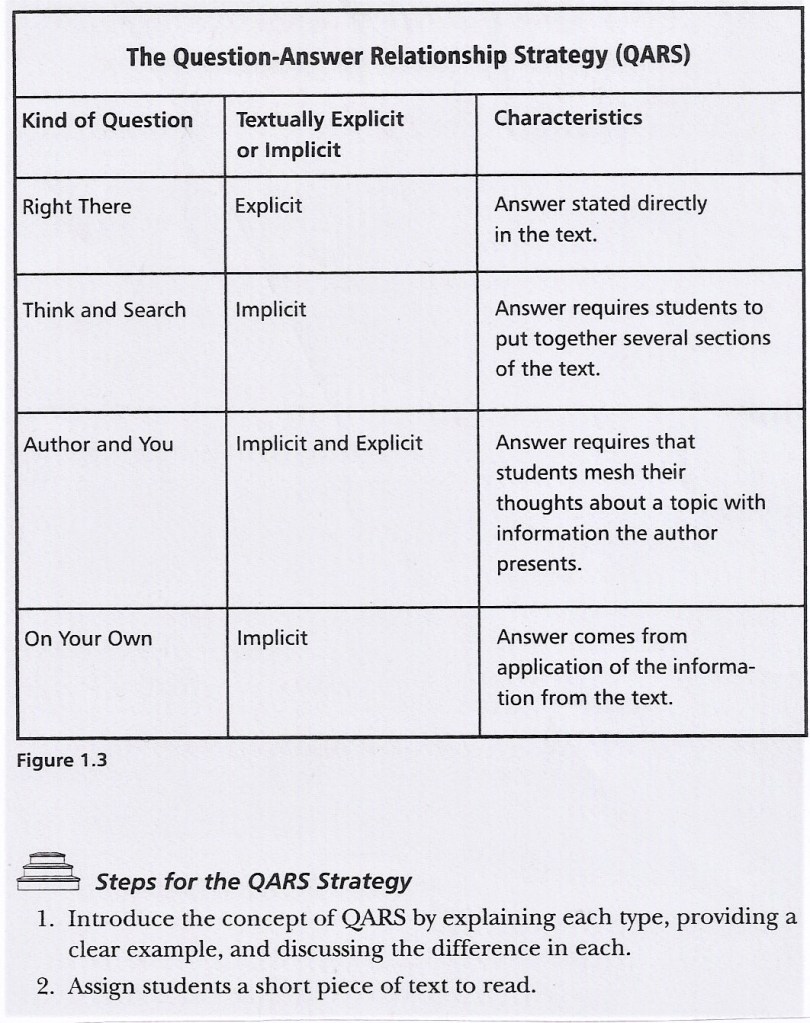
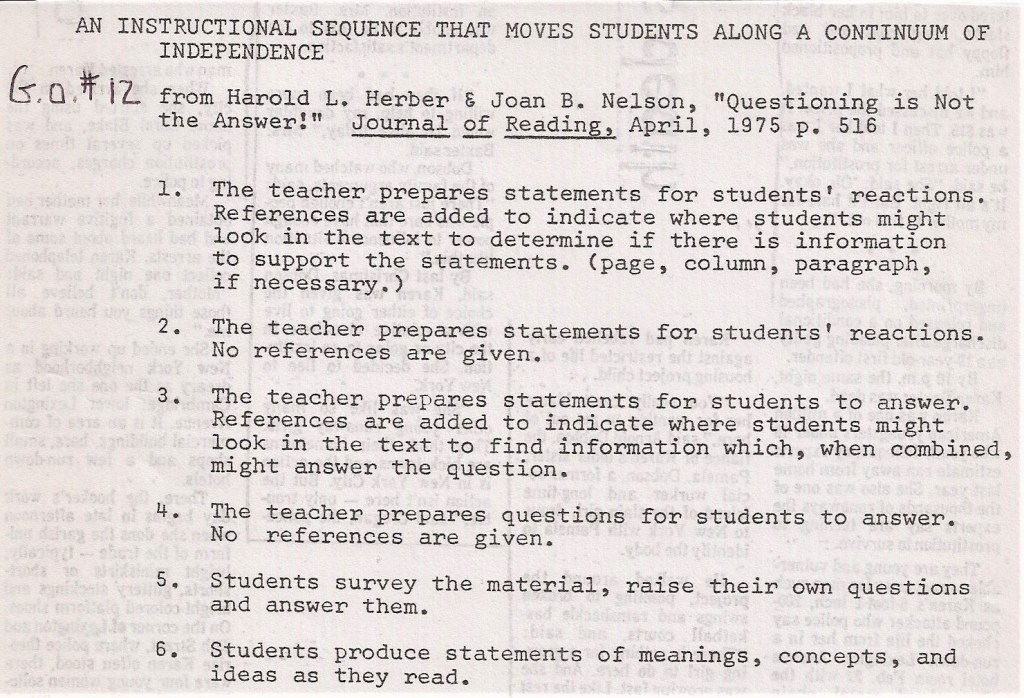
Illustration #12 must be carefully read because it gives teachers a question road map whereby students move from depending on the teacher for questions to their being able to create their own questions or statements.
=========================================
Reading Assignments—Guidelines.
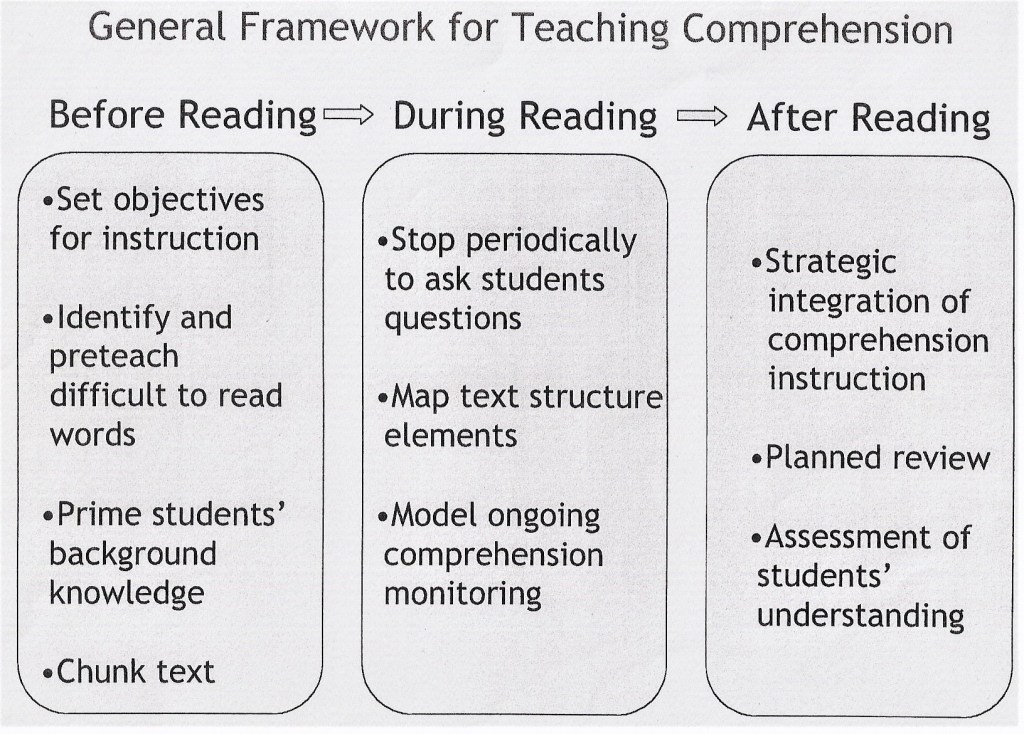
Often, we ask students to independently read before the next class. Then, we expect them to effectively discuss what they have read in class or use the reading to work cooperatively with new materials. Usually, they have not done the reading or if they have they have not retained any meaning. Illustration #13 gives teachers a strategy. Before the assigned reading we must prep students. As they independently read they need note-making tools to direct their reading and capture their reactions. Then, when they arrive in class the next day we can proceed. This is called a BDA strategy. B=Before, D=During, and A=After the reading.
Post Assignment Learning Strategies—Guides.
On the previous day we assigned a reading. Now, in the next class we want to build learning based on their reading. Guides are a tool. There are different types. GO#14 illustrates a comprehension levels guide.
GO#14 illustrates a comprehension levels guide. There are 3 levels: factual, interpretation, and judgement.
Illustration # 15 – Cause & Effect Patterns
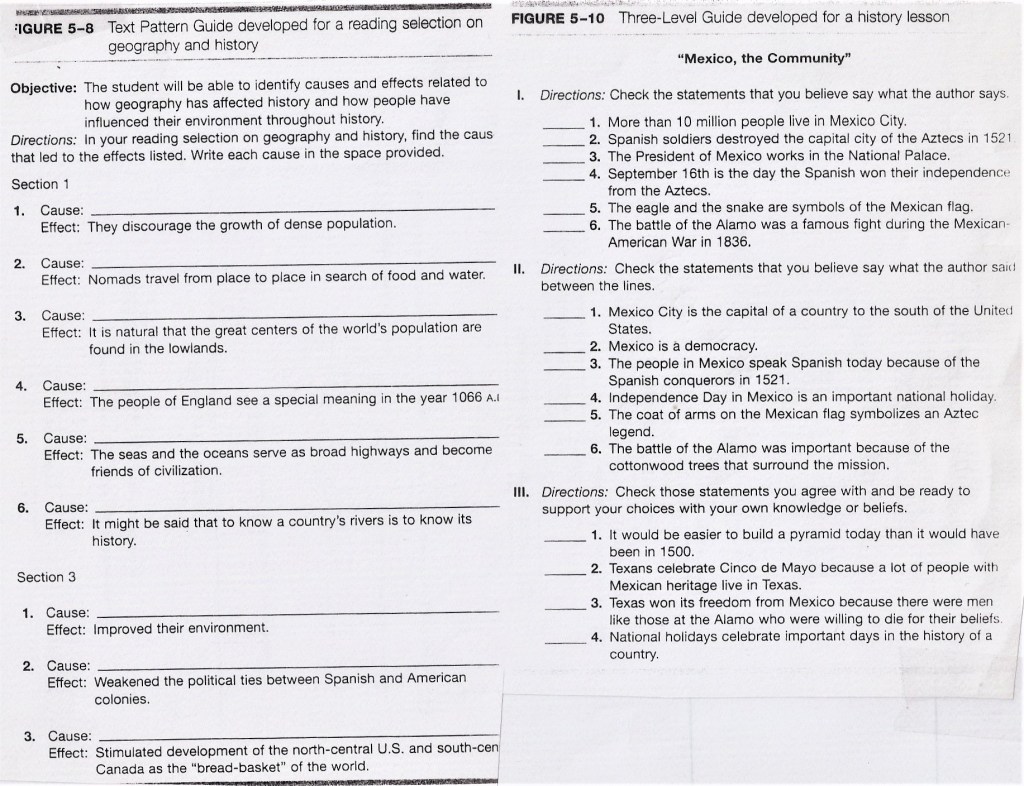
This is a statement not a question guide. Use statements to trigger thinking. Statements open the mind. Questions corner the mind in one direction. Illustration #15 shows a cause/effect pattern guide and an author’s intention guide.
Illustration #16 uses lyrics from a ballad At Seventeen and develops a concept guide.

Illustration #17 uses a Claim/Point of View Statement Guide
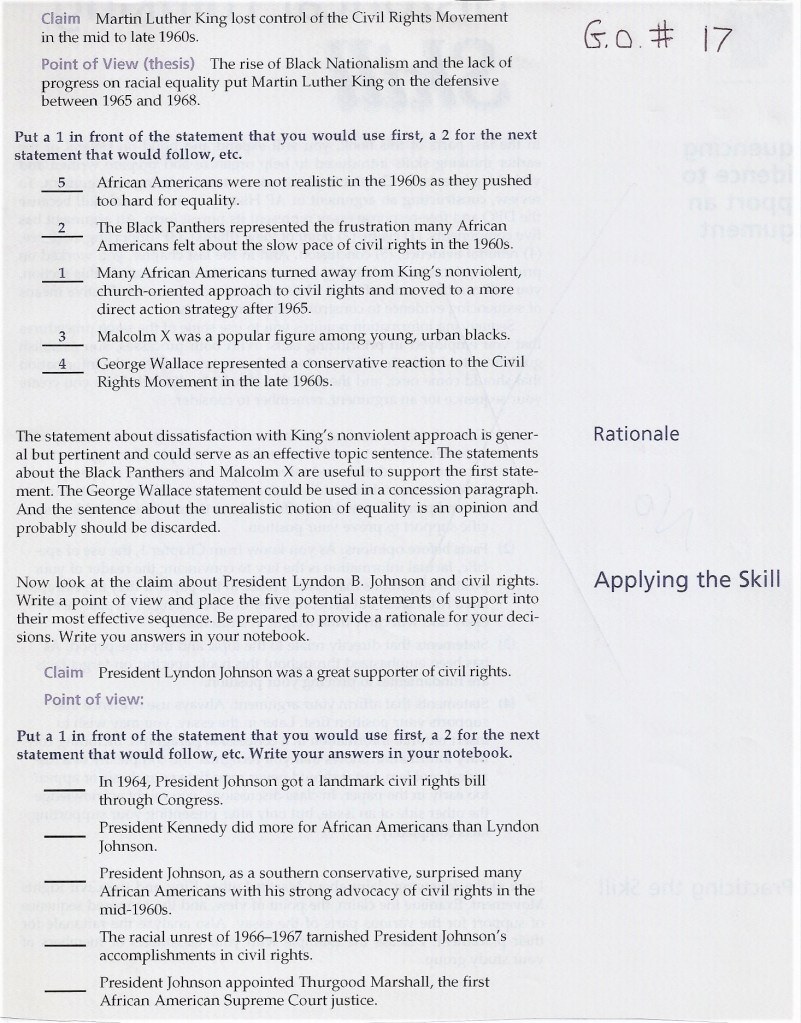
Illustration #18 concludes our guide samples by showing how our colleagues in science use guides. This two part guide was developed by Dr. Judith Thelen from Frostburg State, Maryland.

=====================================
Reading is one tool we use for learning. We don’t teach it. We use it for our academic goals. But, in using it we must not assume students automatically will read and bring critical skills to our classroom. We have to use our tools in the teaching learning process.
Part 1 – Academic Literacy – Learning with Visuals
“In elementary school all students are taught to read. Who teaches them to see. They may be mentally blind.”
Task #1 is defining the term “visual.” See illustration Gathering and Organizing #19. At the bottom is a line graph. Numbers 1-10 are flat, frozen visuals. The numbers proceed from #1 abstract symbols such as a plus or minus sign to #10 realistic photographs. Numbers #11 to #13 are electronic moving visuals. Our focus is on flat frozen visuals.

“A painting is signed. A photograph is not. Why?”
Illustration #20 is a visual interpretation chart. The chart argues that all visuals have a producer with intent and aim. The visual can vary. Finally, there is a receiver or audience which has a memory and reason for seeing the visual. We can always use this generic chart in our classes.

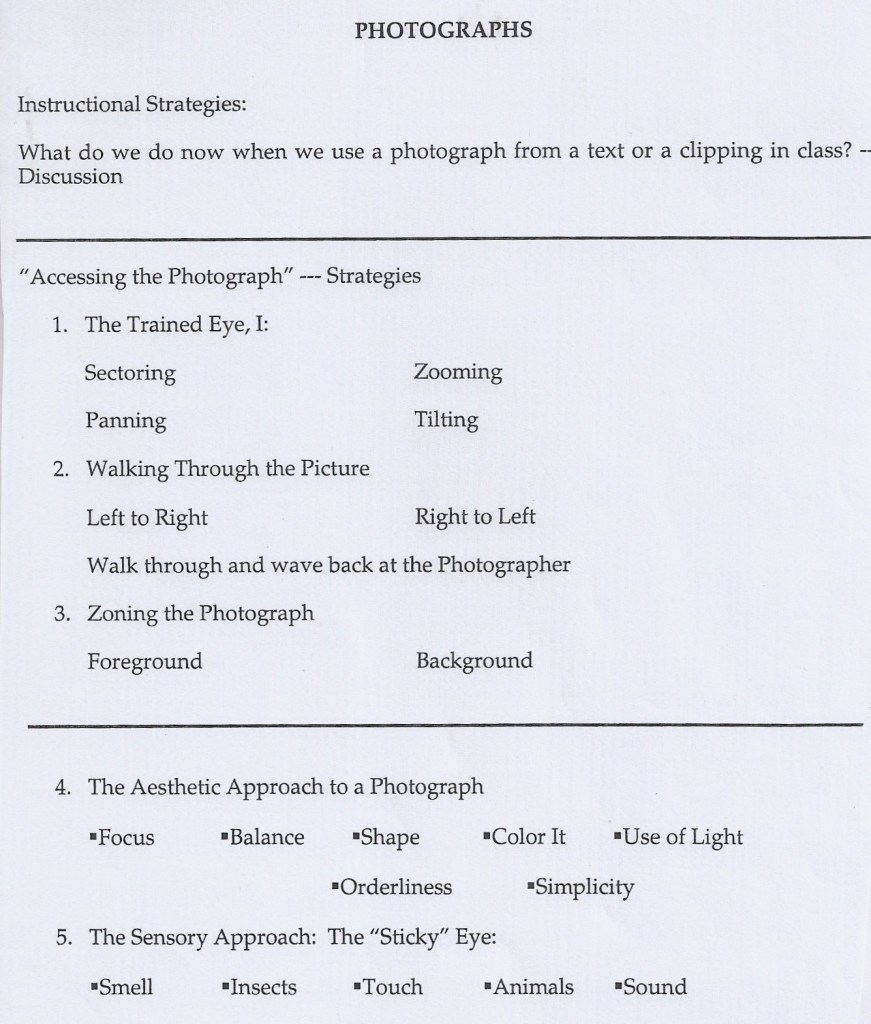
The most commonly used visual is the photograph. Read illustration #21 for an orientation to photographs. Pick one of the Thoughts at the bottom and discuss its meaning with students.
“Looking is easy. Seeing is an achievement”
Following are instructional activities we can use when a photograph or pictorial illustration serves our teaching objectives. Illustration #21 is called Invading the Picture. Let’s use it with an illustration of the Battle of Omdurman in the Sudan in 1898. The illustration is extremely dense with information. We can ask students to tell use what they see or we can deliberately guide them in an inductive teaching manner. Accessing the illustration has three approaches. First is the trained eye. We can sector or divide the scene into observable parts. The white area seems to divide the two forces. We can pan the scene from left to right or top to bottom gathering information. We can zoom shot on one tiny feature and expand the meaning. For example, using a clock technique go to 11 o’clock in the extreme upper left. There is a river. In the river are boats. Next to the river are masses of assembled troops.
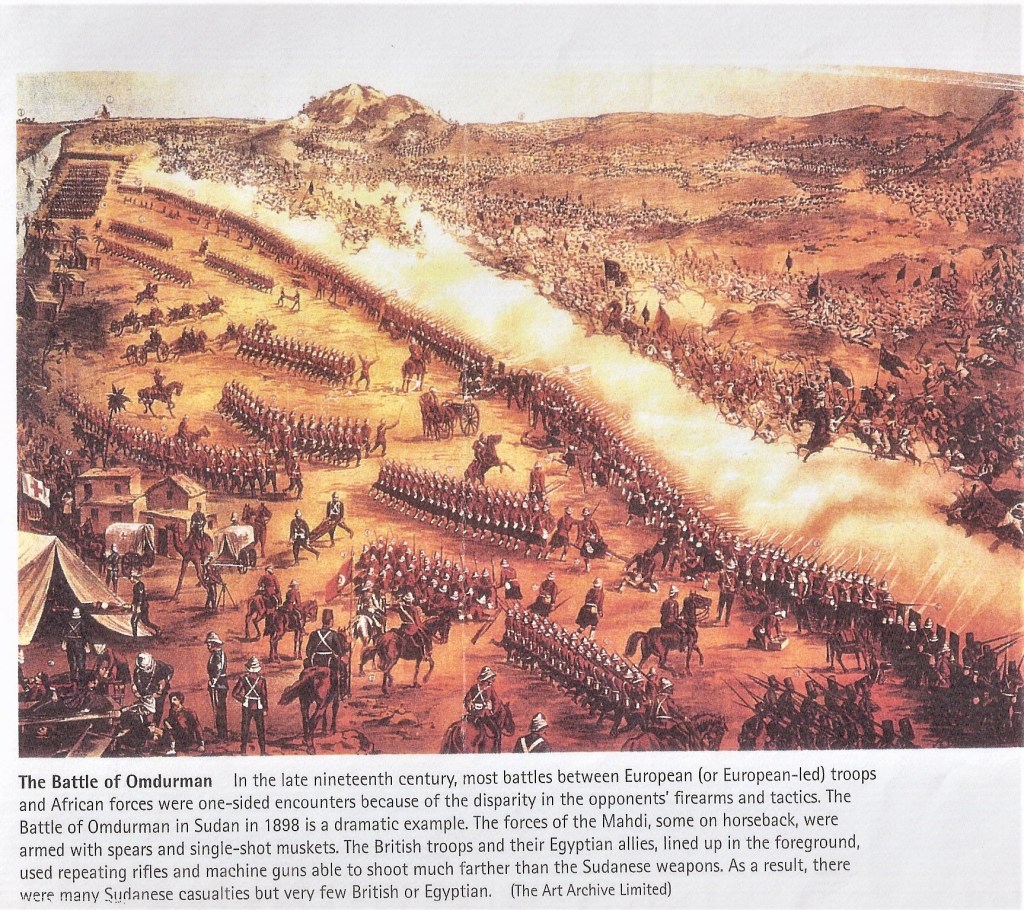
What does this zoom or punctum (point) shot tell us? Rather than walk across a desert to the battle the British brought their rested troops aboard ships before disembarking them. They were well fed and had plenty of water so when put into the battle they were fresh. A final technique is called the “tilt” eye shot in which the viewer is looking down on the scene as if in a drone. We do not simply look. We have a guided eye.
A second approach is called walking through a picture. A third is called zoning the illustration
“A photograph or illustration is time’s witness stopping it forever.”
The 4th and 5th approach to invading a photograph or illustration are the aesthetic and sensory approach.
“Does a photograph have meaning or is the meaning brought to the photograph?’
Illustration #23 is an action photographs that accompanied an article about a football game being played while a school was burning down.
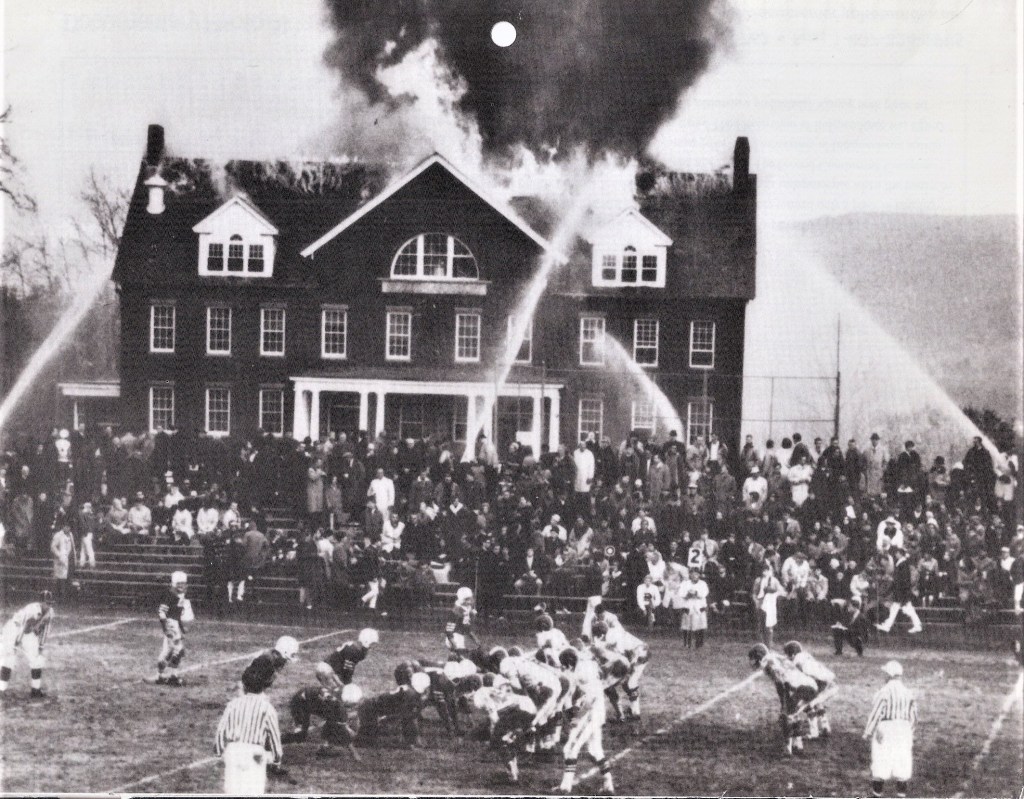
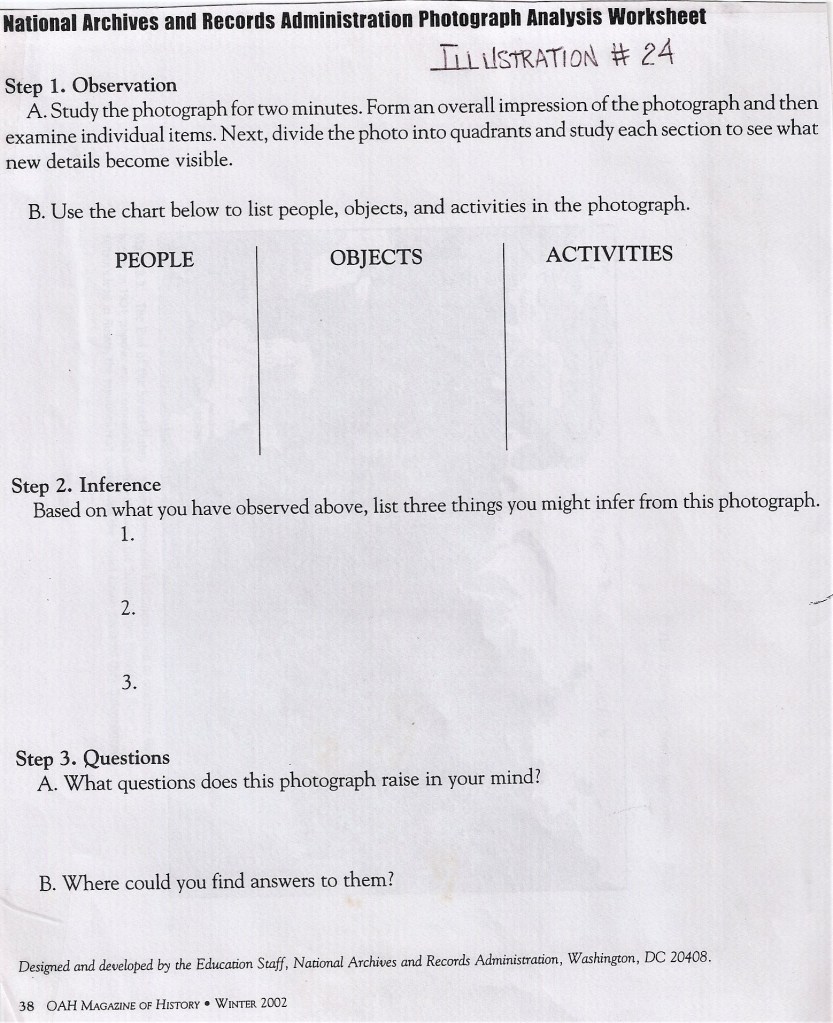
Illustration #24 can be used with the same photograph. A four column analysis is used. People-who are the people we see? Objects-what things do we see? Connect them to the people, Activities-what actions do we see? Now, add a 4th column IDEAS what ideas or idea does the photograph convey? This is a POAI-Chart.
“A photograph both fixes and steals time.”
Illustration #25 Photograph as a Text shows us how we can tell a Story from a photograph. Students are given the story chart in the illustration. A photograph called Paris Bistro is our scene.
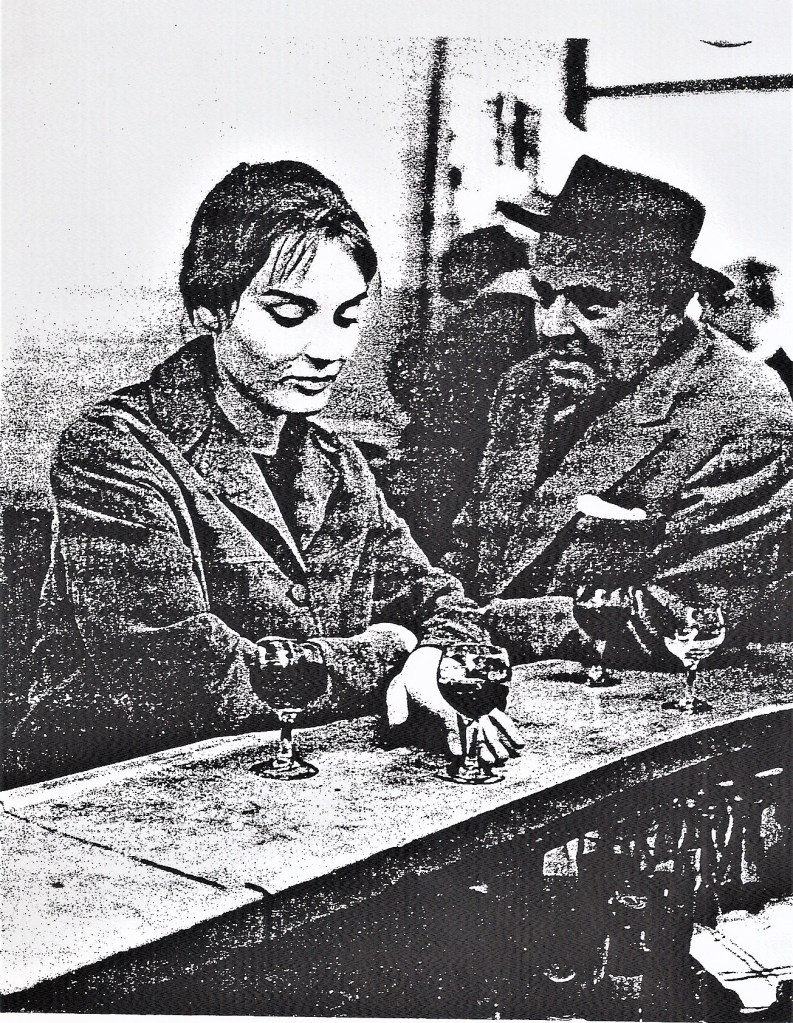
The left side of the chart sets our theme. What are the intentions of the two people in the picture. Where in the SHOT is there evidence of the intentions, the argument or thesis claim of the photographer. What might the plot be? What is the sequence of events. What were these two people doing an hour before they met and an hour after. Do we see any conflicts?
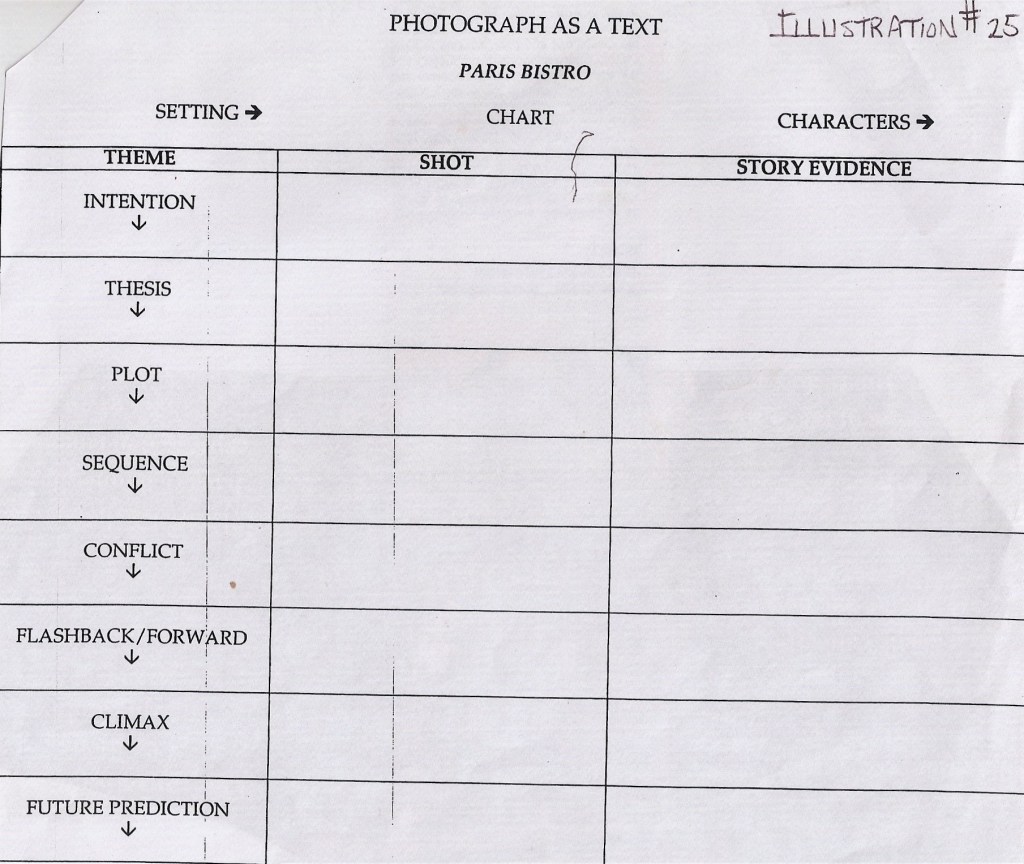
What happened before? Later? How might this end. Is this a father speaking to a daughter? Is this a husband talking to a wife? What does the future hold? This story telling technique could have also been applied to the Omdurman illustration.
“A photograph is insight, not sight.”
Illustration #26 shows another learning strategy.
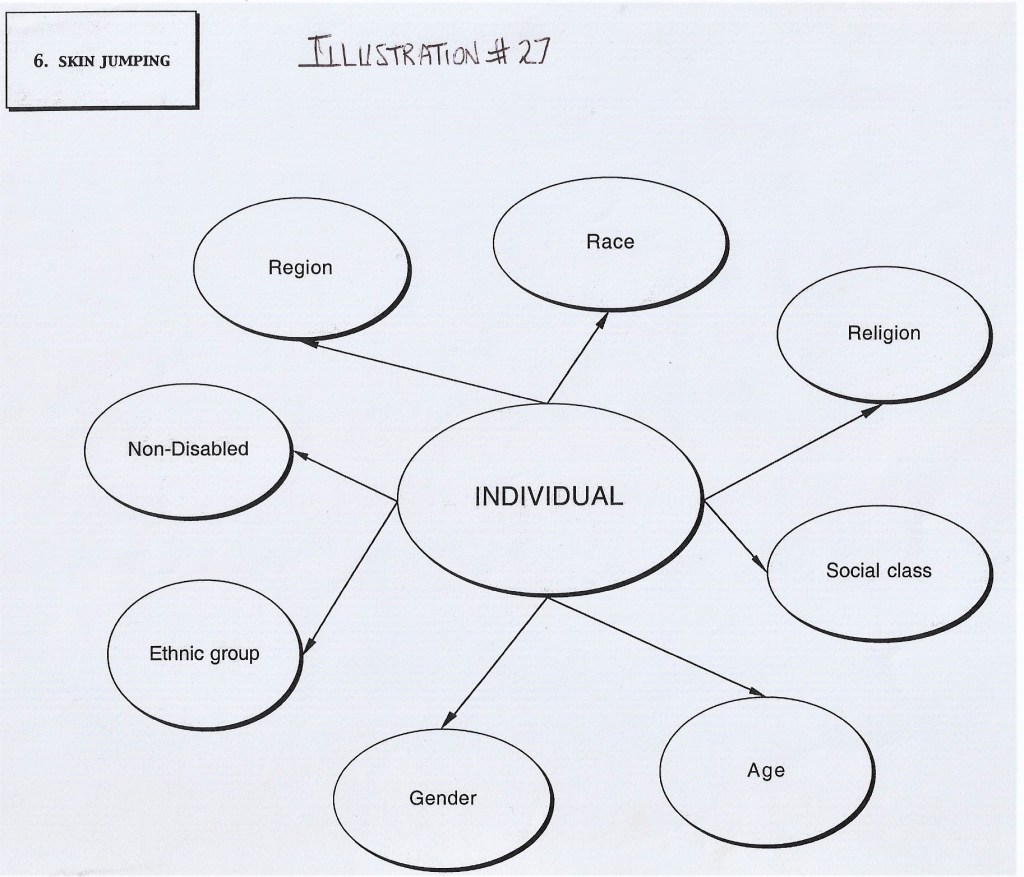
Illustration #27 is a very different learning idea. It is called skin jumping. Different people bring a different “eye” or “I” to a picture. Using the Paris Bistro picture how could or would a viewer of a certain race, religion, social class, age, gender, ethnic group, non-disabled, disabled, or from a certain region of a country view the picture.
“The mind is the real instrument of sight and observation.”
Photographs and illustrations are two visual types. Paintings and portraits can also be used in our classes. Illustration #28 gives us some general ideas about comparing and contrasting these visual forms.

Illustration #29 depicts a young Frederick Douglass. What do we “see” or “feel” in him? As you learn about Douglass, using his portrait draw a line from his head outward. On the line print the major ideas he is thinking. Next, draw a line outward from his eyes. On the line print what you think his hopes are. Then draw a line from his mouth outward. On the line print what you think he might have said. Next draw a line from his ears outward. On this line write what you think he might have heard. Look at his hands. Draw a line indicating what actions he took. Draw a line from his upper arm. This is his muscle. Write his strengths on this line. Finally, locate his heart and draw a line outward from his heart. On this line write what you think his feelings were. Therefore, when you teach Frederick Douglass, use a visual with your students to help them in organizing their thoughts.

“The painted portrait, a sign of wealth. The photograph a sign of democracy.”
Illustration #30 is used with artistic images.
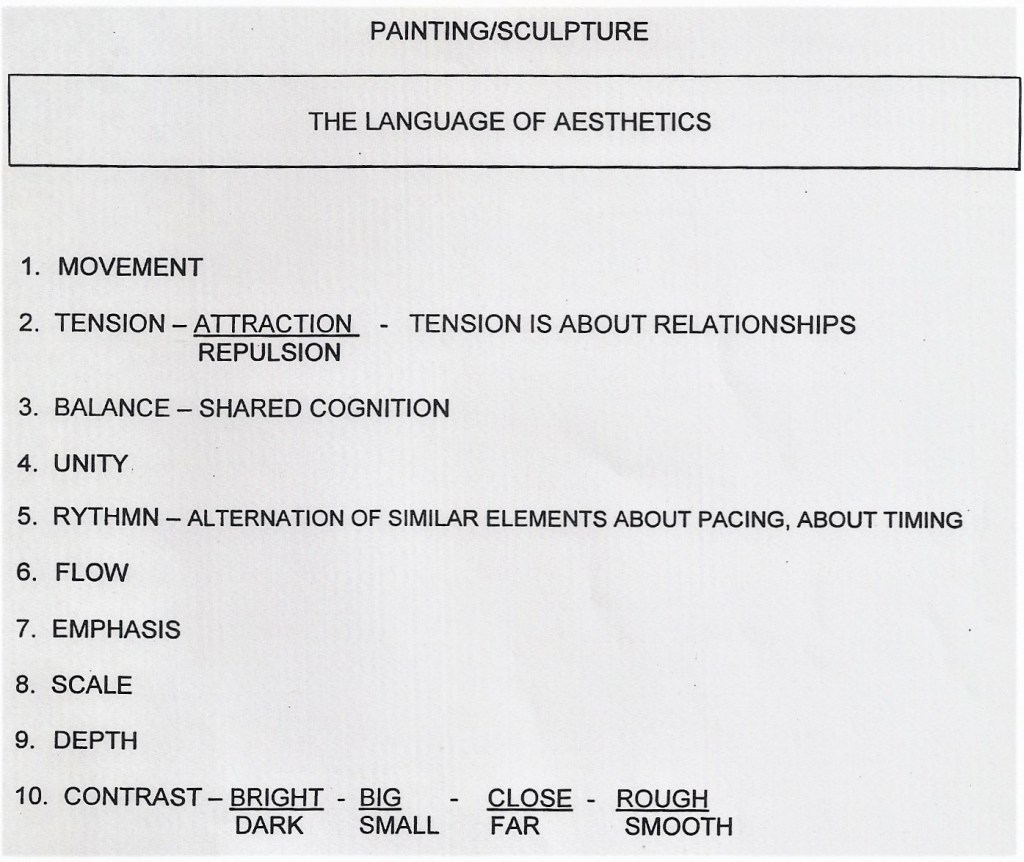
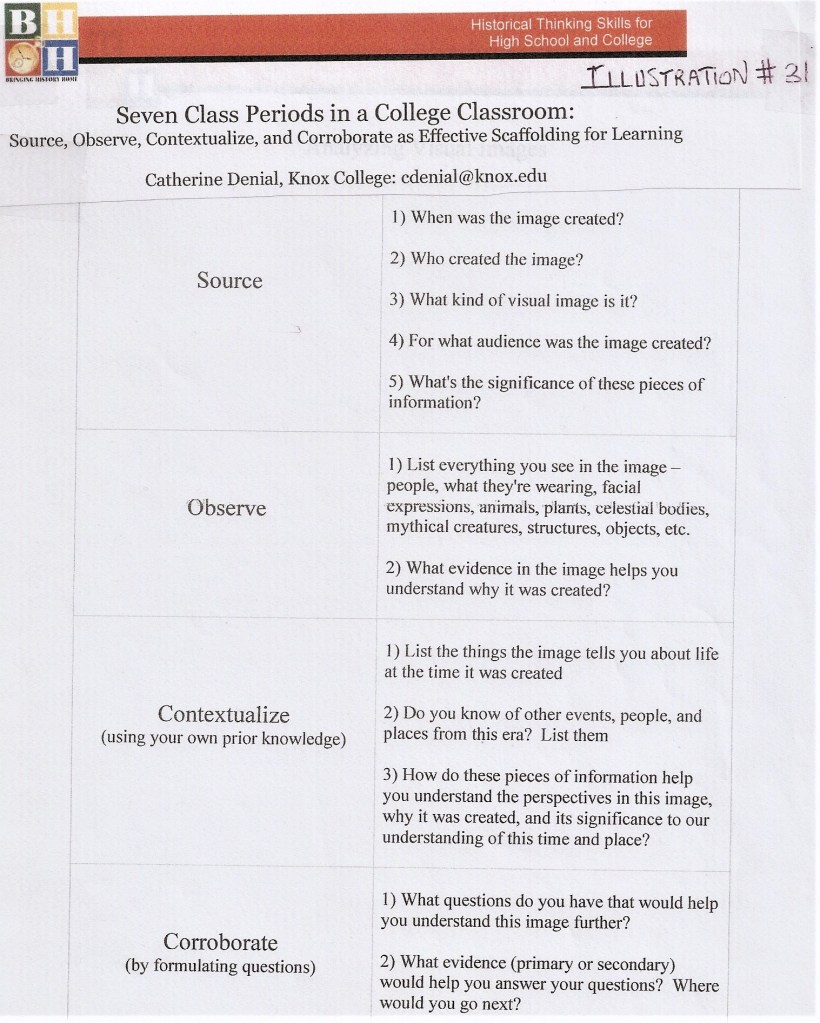
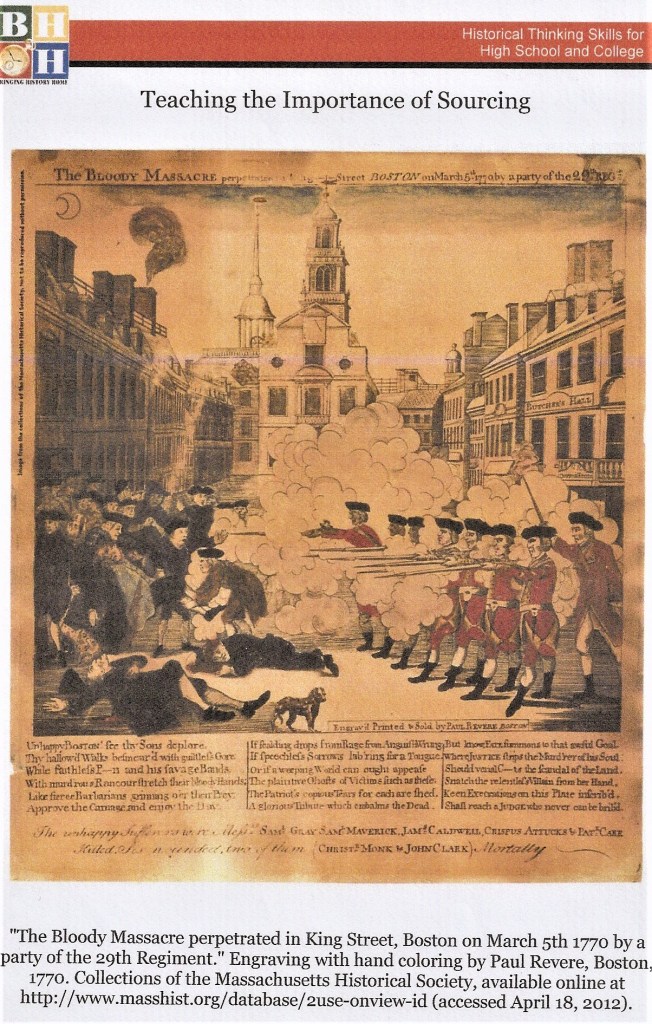
Illustration #31 from Catherine Denial of Knox College gives us an SOCC approach: source, observe, contextualize, and corroborate. This approach could be used with either Omdurman or the football fire scene. She uses it with the famous Boston Bloody Massacre scene of 1770.


Our final visual is a graphic illustration #32 used in a history of American addictions. A POAI approach from Illustration #24 could first be used. Make notes on the handout illustration. On the left side is a Q/S column. Students are asked to write and answer 3 questions or statements they have about the illustration. At the bottom of the illustration is a paragraph writing technique called T3BCO. In a paragraph state the T or topic. Then list the three ‘becauses’ or evidence to support the topic. C=the conclusion.
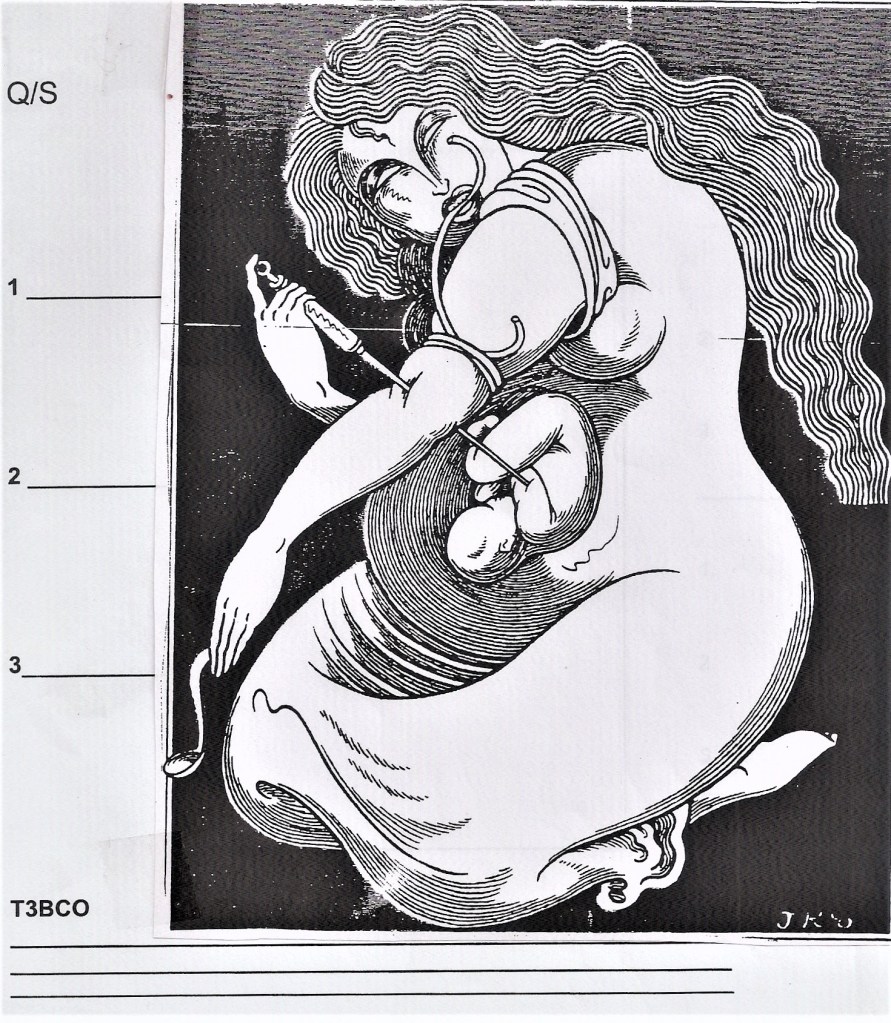
Illustration #33 is a visual teaching planning chart. Using illustration #19 plan how you can teach with visuals in a 9 week marking period.
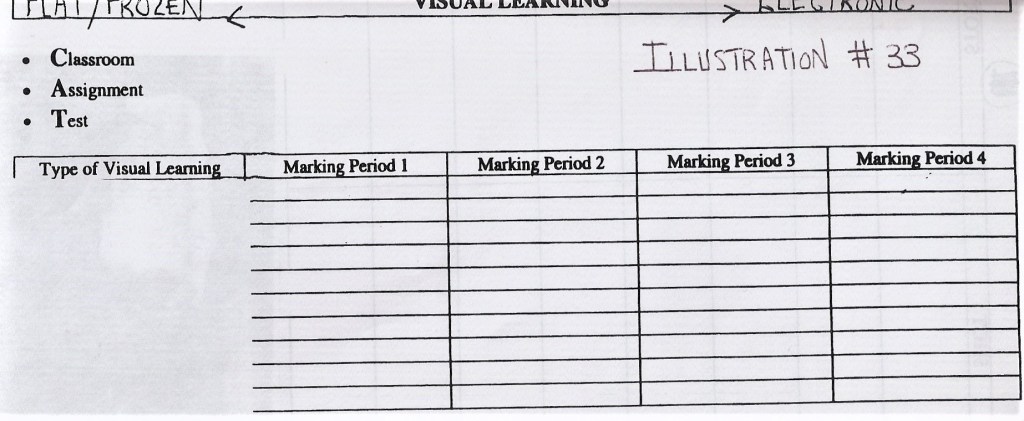
Illustration #34 conveys three ideas about visual learning.
An article on Visualized Notemaking concludes the gathering and organizing activities and gives students a transition from observing to notemaking, the precondition for building memory leading to writing and speaking.

Academic Literacy – Graphical Information
One type of graphical aid is the familiar chart form. Illustration #35 informs us about sexually transmitted infections. Use 3 steps to analyze any chart. Turn the heading into a question, “what are the”. Identify the vertical content, the diseases, and finally identify the horizontal content, the variables of cause, transmission etc. Then complete the chart.

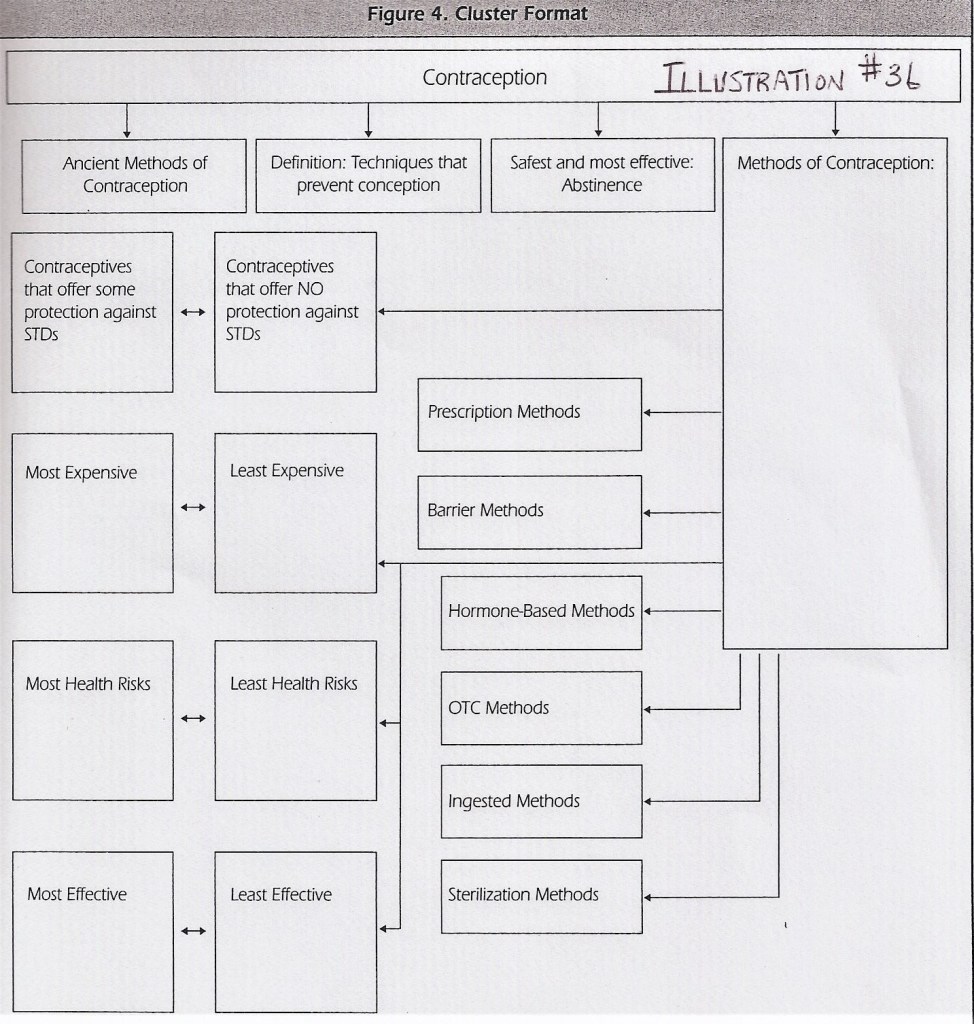
Illustrations #36 and #37 show 2 different chart forms, the CLUSTER and the WEB. Students are directed to the central theme and its offshoots. When viewing these charts use a pen to circle the main theme and draw connecting lines with arrows to the parts. Drawing focuses the eye and mind.

Additional types of charts are depicted in Illustration #38 ABC.
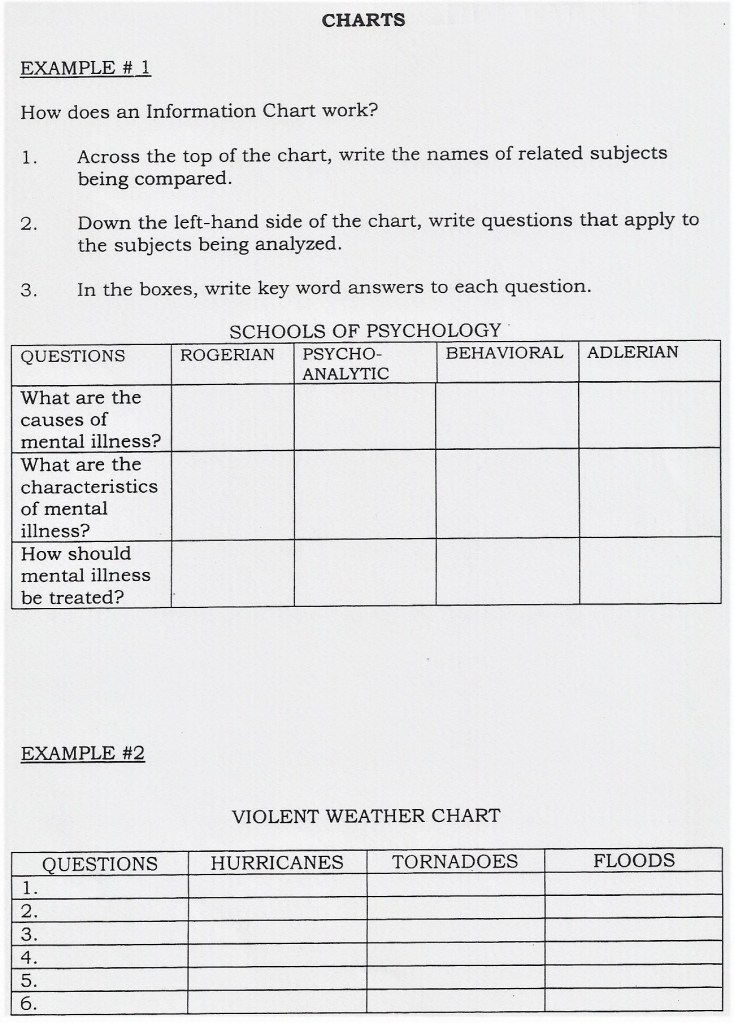


Illustration #39 is an article called the Graphic Information Lesson. It combines maps, graphs, and charts. The author skillfully integrates visual types and thinking skills.
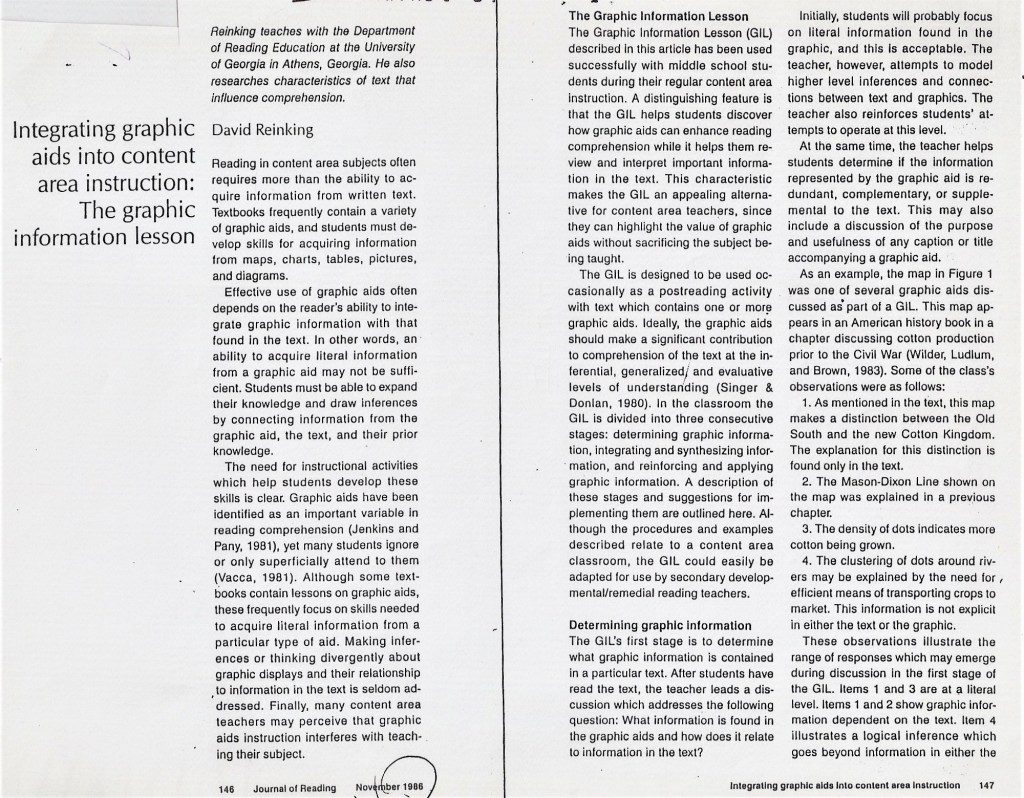
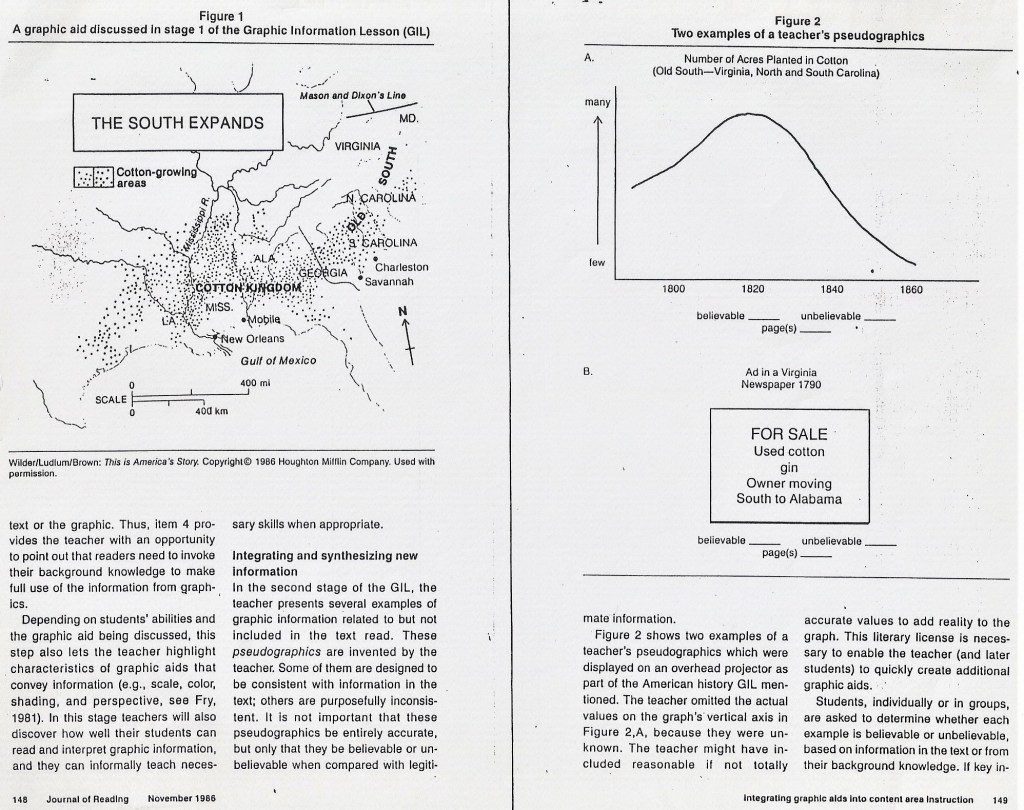
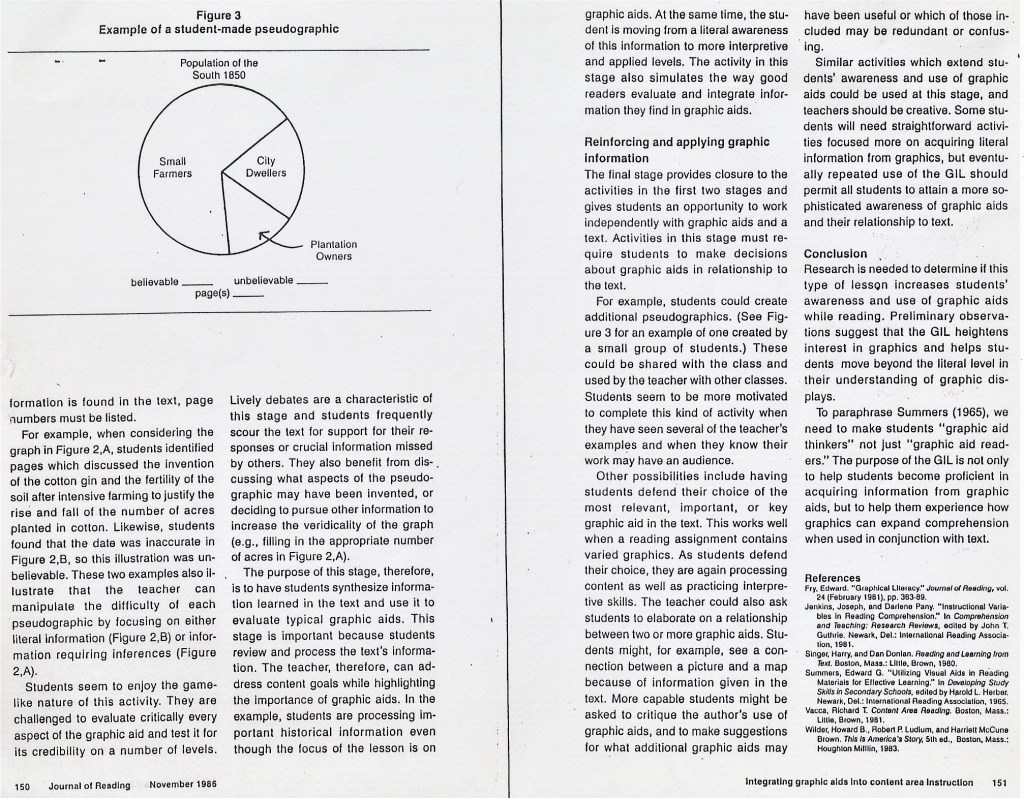
Illustration #40 is an information map that examines the relationships between economic production, the role of government, geography, demography, beliefs, behavior, and economic principles. The concept of public investment infrastructure is shown with an arrow linking government investment to 7 forms of infrastructure: T=transportation, E=energy, C=communication, H=health, I=information/education, PH=public health, ands S=security, police, fire, courts, weather prediction, military, and currency management. Students use the chart for note-making. Apply this to any country or historical era.

Illustration #41 is the author’s chapter on graphs, supplemented by two additional examples.


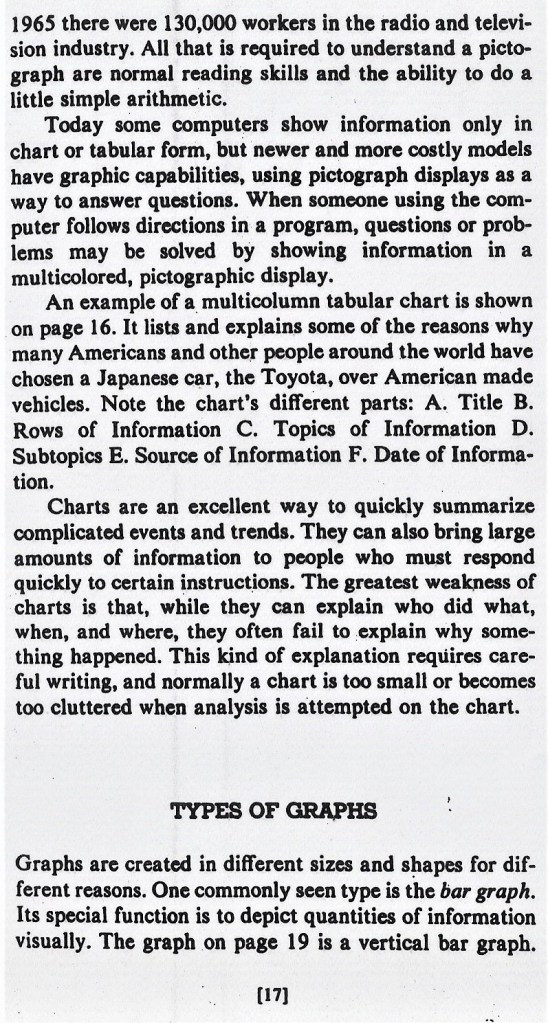
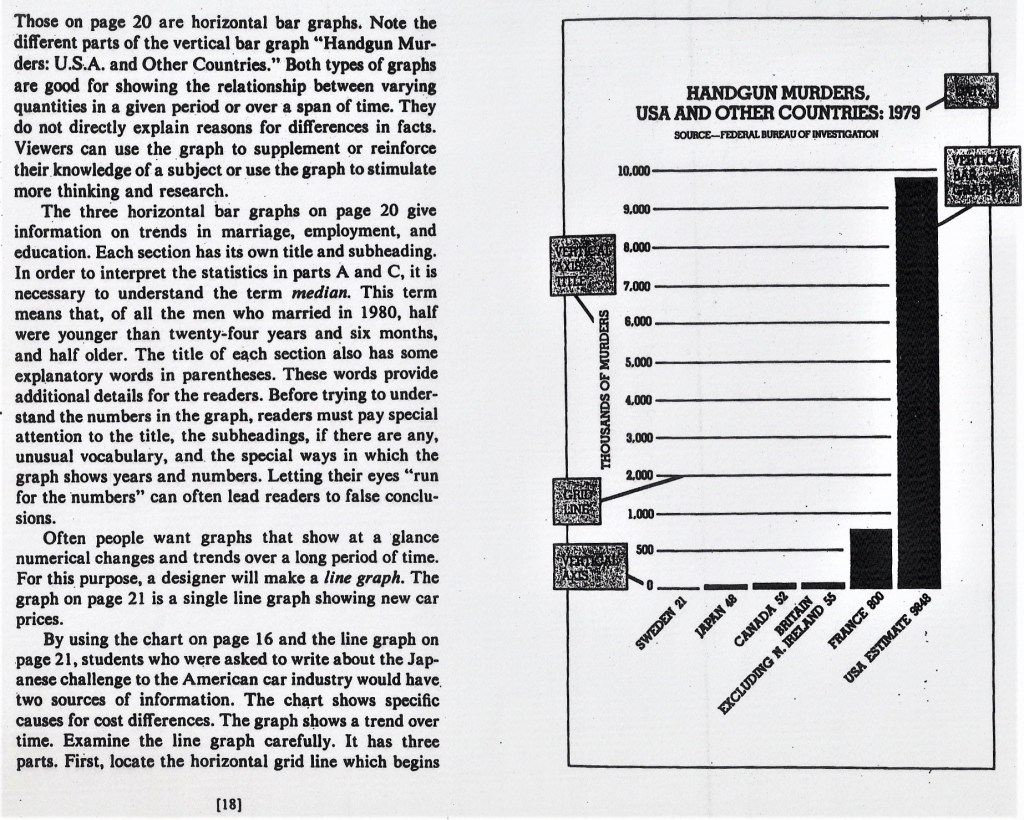
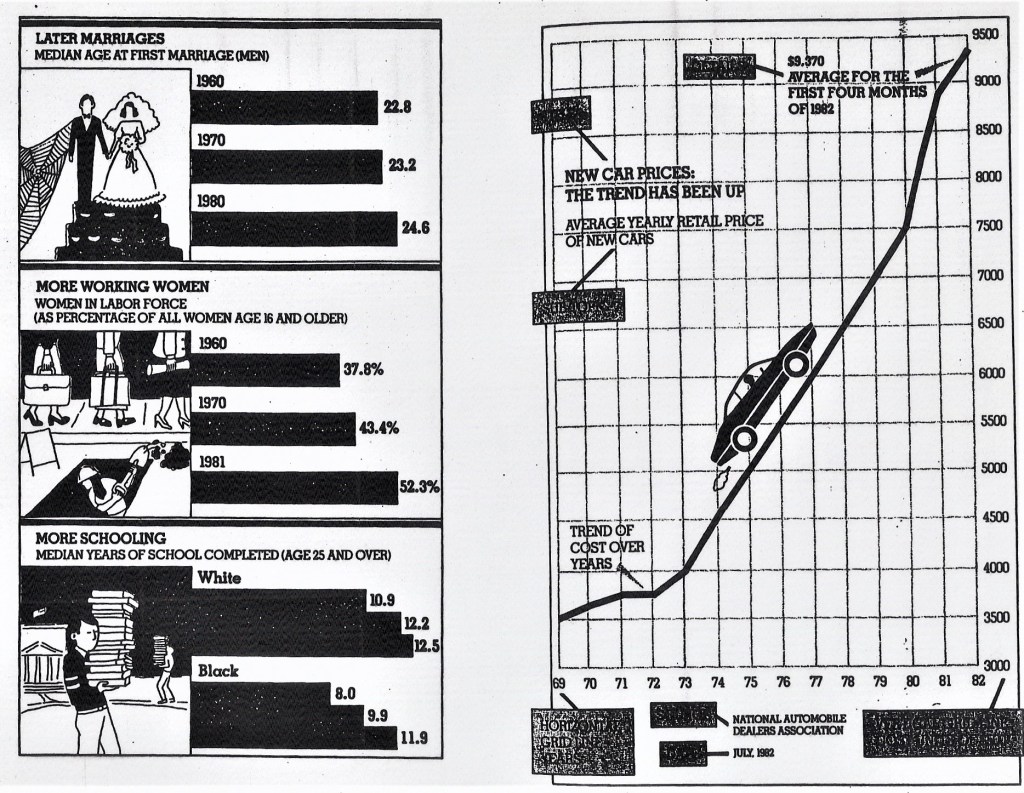
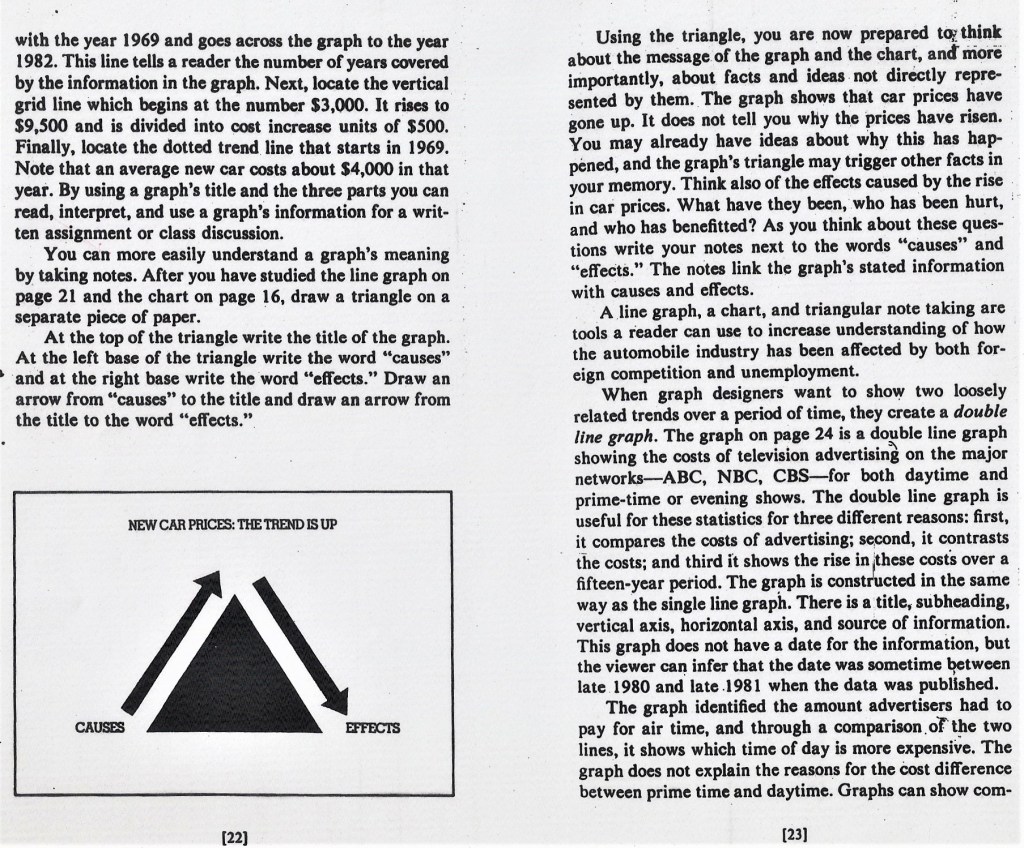
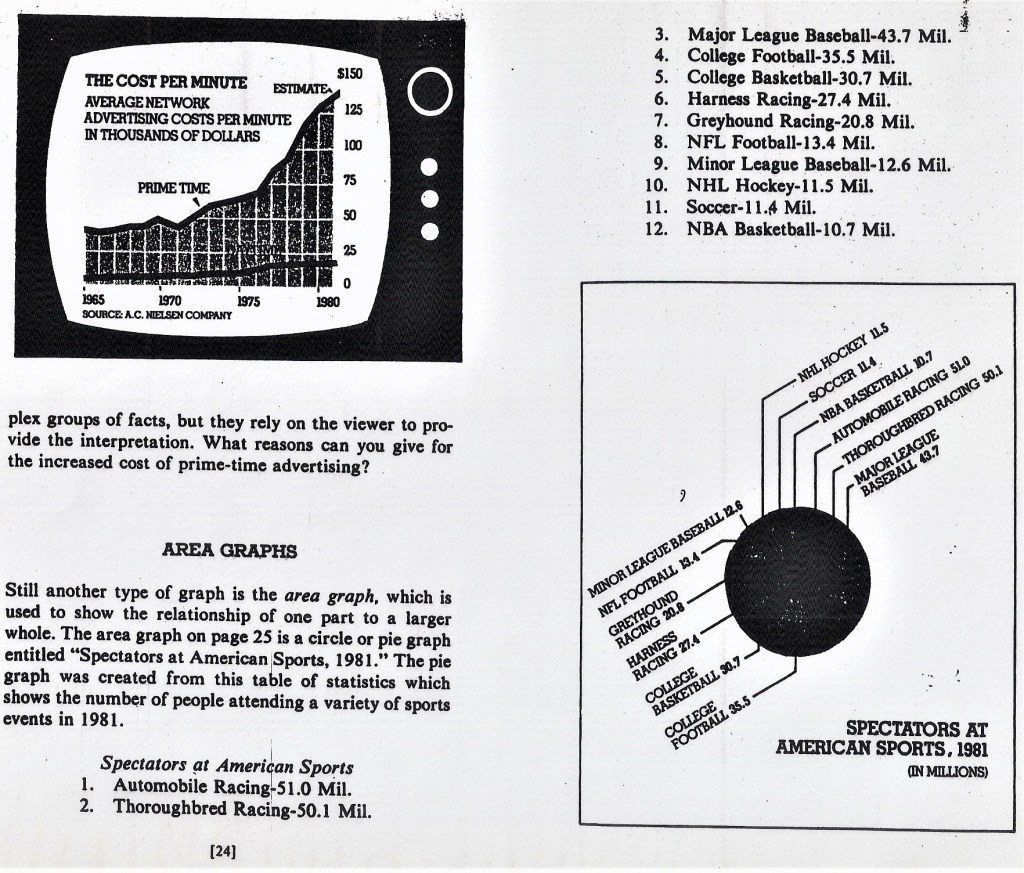
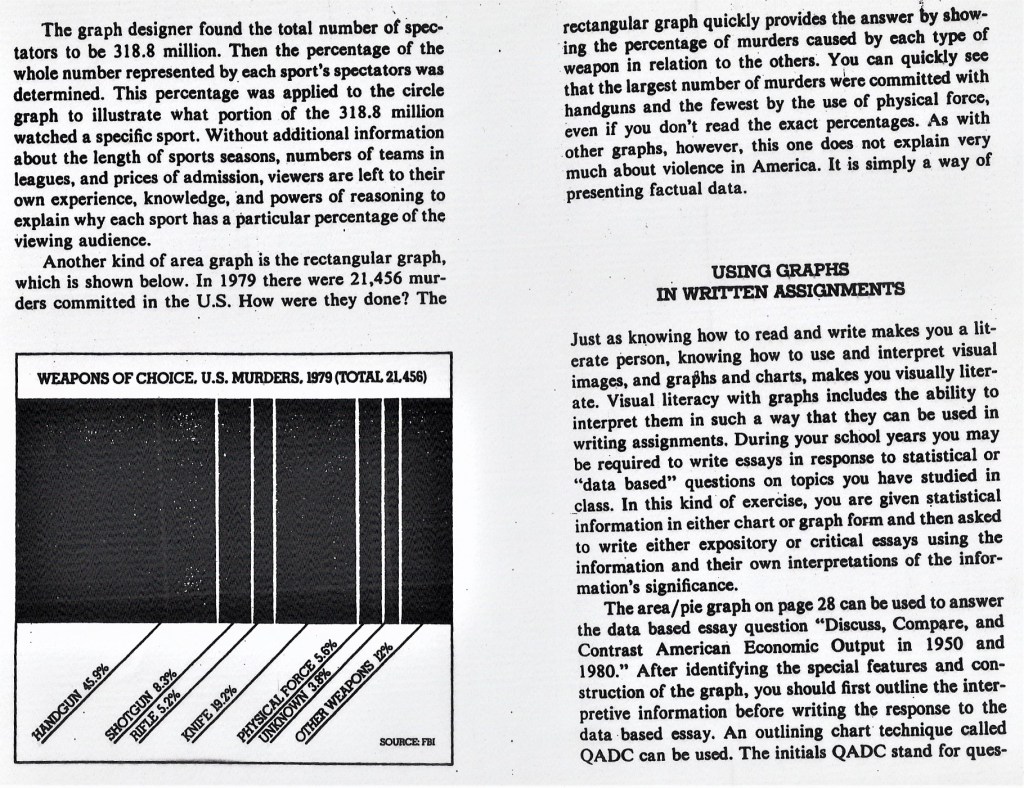
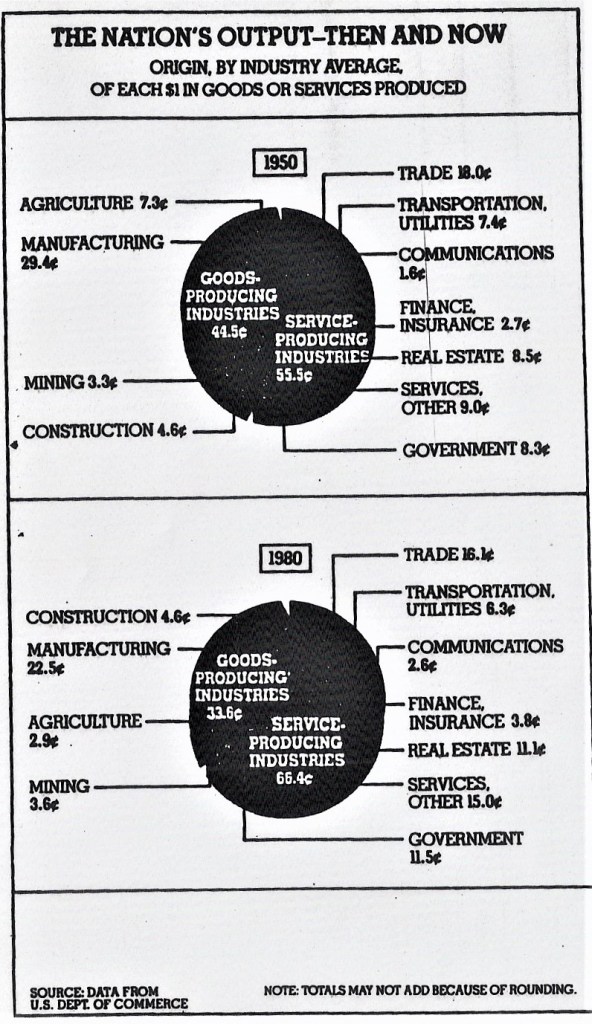

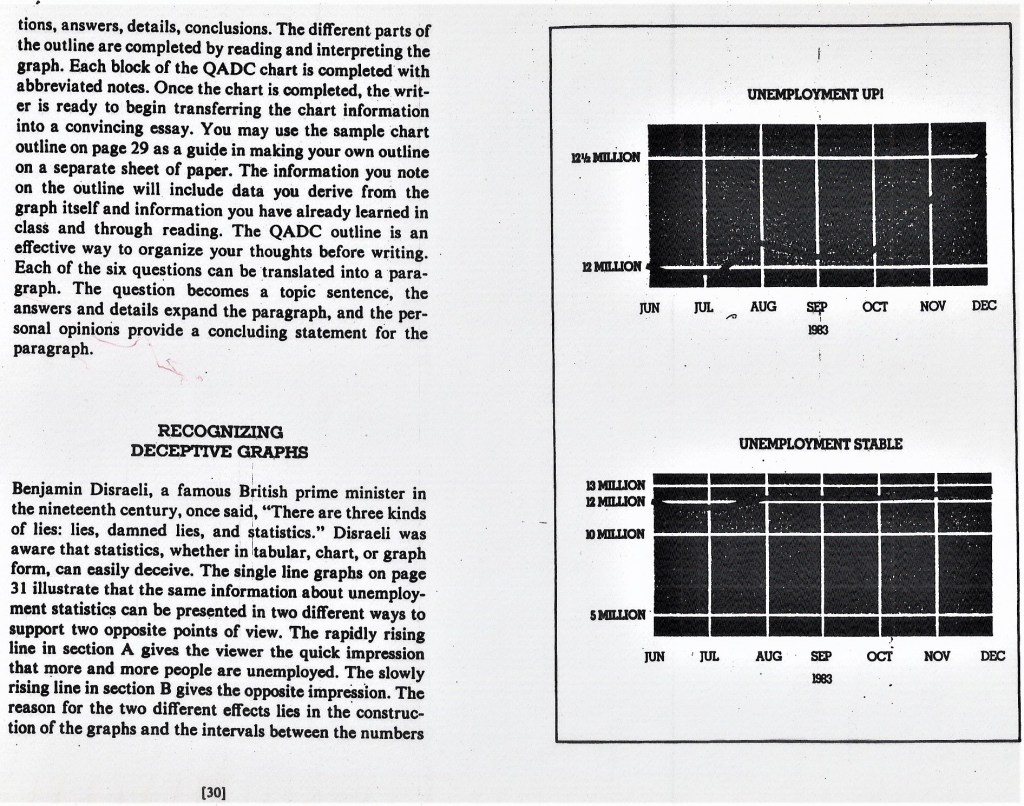
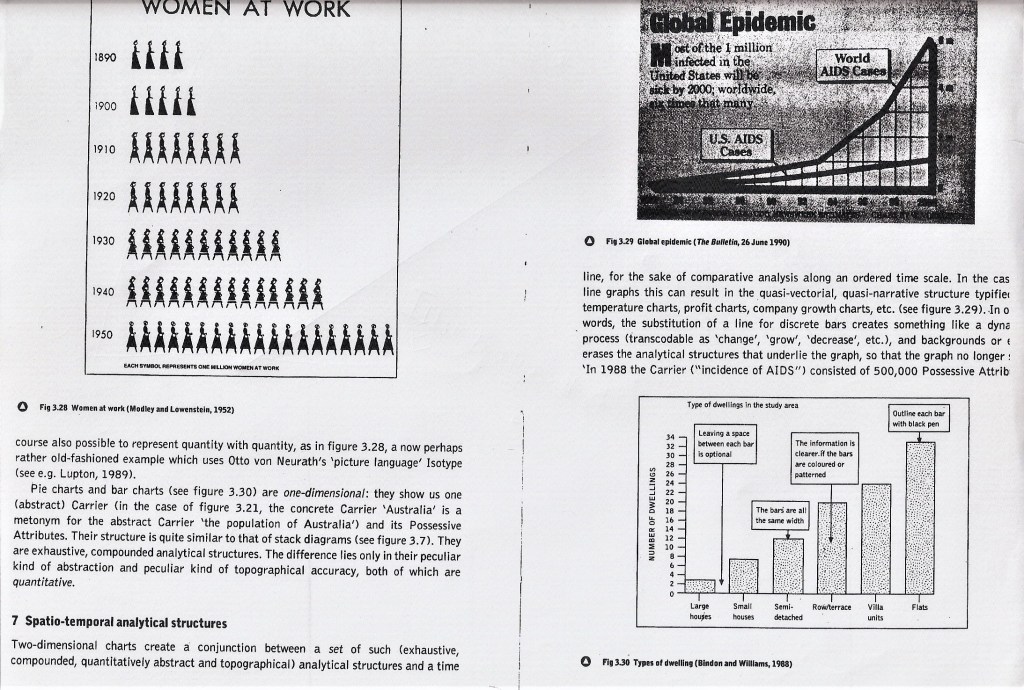
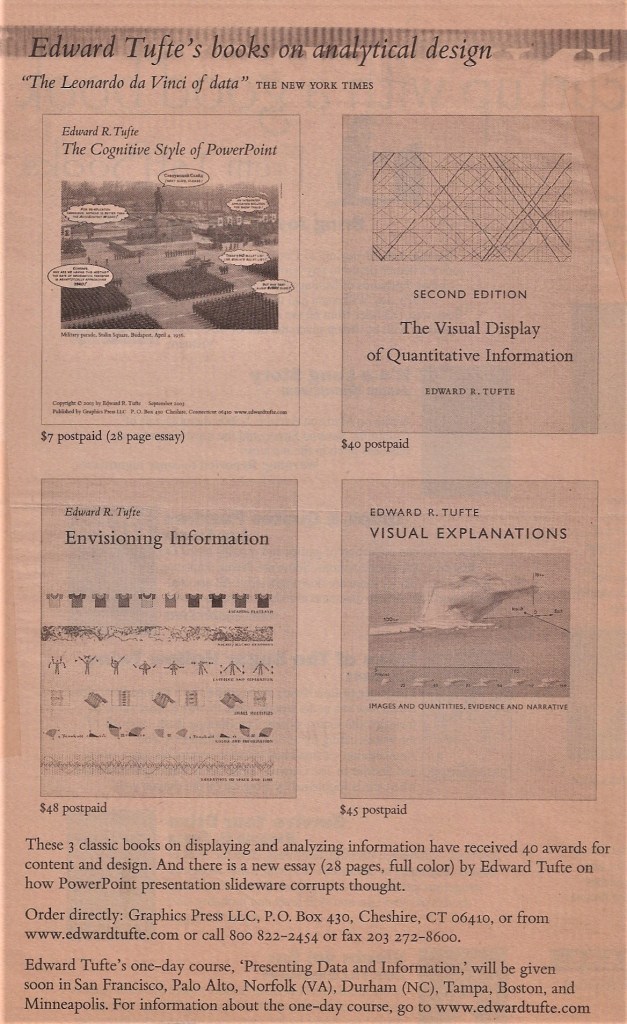
Illustration #42 is a valuable resource by Edward Tufte, the 20th century’s foremost thinker in information design. Gathering and Organizing Information has three components: reading, representational visuals, and graphical aids. These forms occur in all of our texts and materials. Learning to use them is critical and produces life-long learning skills transferable to all careers and daily life. When students can gather and organize information they create a highway for practicing thinking and reasoning. When thinking and reasoning are organized into retrievable memory they are the building blocks for writing, speaking, and other creative acts.