The Impact of Economic Decisions by American Presidents Series
President Ronald Reagan and the Economic Recovery Tax Act
Most decisions by American presidents and other world leaders do not have an immediate impact on the economy, especially regarding the macroeconomic issues of employment and inflation. For example, President Franklin Roosevelt’s bank holiday, President John Kennedy’s tariff on imported steel, and President Ronald Reagan’s Economic Recovery Tax Act had limited immediate effects on the economy, but their long-term effects were significant. The accomplishments or problems of a previous administration may impact on the administration that follows.
For example, President Biden faced criticism about the economy during his administration. The jobs created with the Bipartisan Infrastructure Law and the interest rate policy of the Federal Reserve Bank to lower inflation did not show results until years later. The drop in Real Disposable Income from the administration of President Trump is another example. Real Disposable Income is a measure of income that is adjusted for inflation. The drop between the administration of President Bident and Trump is the result of extended unemployment benefits, people working from home during the pandemic when businesses were closed, and stimulus checks from the government. The economic transition following the end of the pandemic had a significant impact on the economy.
| President | GDP Growth | Unemployment Rate | Inflation Rate | Poverty Rate | Real Disposable Income |
| Johnson | 2.6% | 3.4% | 4.4% | 12.8% | $17,181 |
| Nixon | 2.0% | 5.5% | 10.9% | 12.0% | $19,621 |
| Ford | 2.8% | 7.5% | 5.2% | 11.9% | $20,780 |
| Carter | 4.6% | 7.4% | 11.8% | 13.0% | $21,891 |
| Reagan | 2.1% | 5.4% | 4.7% | 13.1% | $27,080 |
| H.W. Bush | 0.7% | 7.3% | 3.3% | 14.5% | $27,990 |
| Clinton | 0.3% | 4.2% | 3.7% | 11.3% | $34,216 |
| G.W. Bush | -1.2% | 7.8% | 0.0% | 13.2% | $37,814 |
| Obama | 1.0% | 4.7% | 2.5% | 14.0% | $42,914 |
| Trump | 2.6% | 6.4% | 1.4% | 11.9% | $48,286 |
| Biden | 2.6% | 3.5% | 5.0% | 12.8% | $46,682 |
This series provides a context of important decisions by America’s presidents that are connected to the expected economic decisions facing our current president’s administration. The background information and questions provide an opportunity for small and large group discussions, structured debate, and additional investigation and research. They may be used for current events, as a substitute lesson activity or integrated into a lesson.
In the case study below, have your students investigate the economic problem, different perspectives on the proposed solution, the short- and long-term impact of the decision, and how the decision affects Americans in the 21st century.
President Roosevelt introduced Social Security as a transfer payment to workers who would retire at age 65 with a life expectancy of 70 years in 1940. The income of workers was taxed, and Social Security was generously funded by workers. Today, there are only two workers contributing to Social Security for every retiree receiving a monthly check. It is considered a transfer payment because the money received is spent locally on basic needs and part of the amount is taxed.

President Johnson expanded Social Security to include Medicare and Medicaid. President Reagan began taxing the benefits received, raised the retirement age to 67, and allowed for contributions from payrolls to Individual Retirement Accounts. President Trump raised the age from 70 ½ to 73 ½ regarding required minimum withdrawals from private retirement accounts.
The Economic Problem
Retirement is a relatively new concept in economic history. Social Security began in 1935, and American presidents have made significant changes to it, especially in the last 50 years. Defined pension plans were offered to employees in the first half of the 20th century but became too expensive for most corporations. Today, many public service workers, teachers, police, fire) have defined pensions and receive a monthly distribution. Without monthly Social Security payments, it would be difficult for retired individuals to live above the poverty line.

The evolution of Individual Retirement Accounts began with President Gerald Ford in 1976, and presidents have made changes to it over the past 50 years. Most American workers have an IRA, which may be called a 401(k), 403(b), Roth or something else. Today there is $40 trillion invested in mutual funds and U.S. securities in IRA accounts of Americans. In this case study, you will analyze the economic importance of this money, which is about equal to the national debt of the United States government. Today, about 40% of American households have an IRA account. Most of the remaining 60% will depend on Social Security, personal savings and assets, or fall into poverty.
Questions:
- How does having approximately 8% of your paycheck withheld for Social Security and Medicare affect the economy, stock market, and the quality of family life?
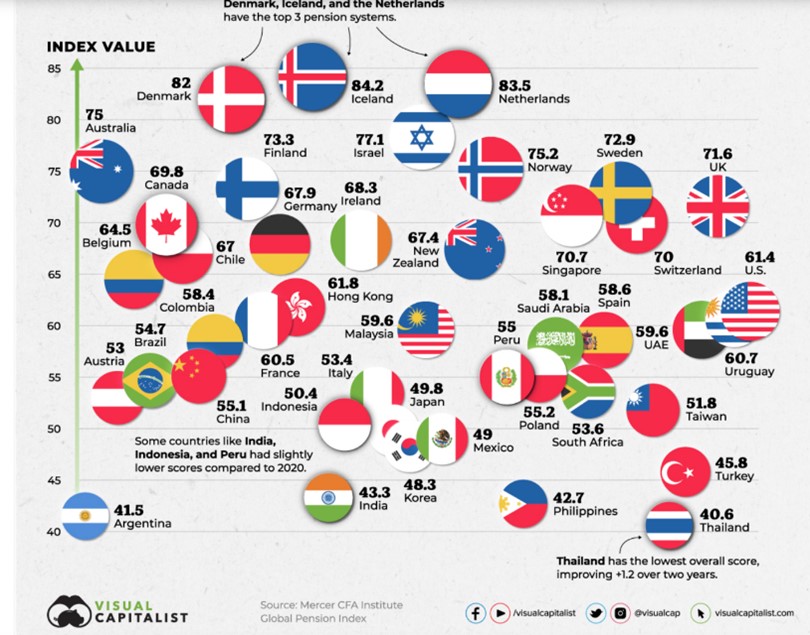
- How do other countries provide support for their retirees? Is it valid to compare a large country (USA) with a smaller country with a higher ranking (Denmark)? Source
- If you were an economic advisor to our current president, what reforms regarding Social Security and retirement income would you suggest?
- What risks do current and future retirees face in the short term (next five years)?
- Are the options for investing in retirement accounts reasonable, too risky, or too limited?
Report on the Economic Well-Being of U.S. Households in 2023-2024
Statement on Signing the Retirement Equity Act of 1984
Activity #1: The high cost of taxes
- Use the table below to calculate the taxes that the average worker in the United States who owns a home pays in state and federal taxes.
| Item | Percent of Taxes | $100,000 Example | $200,000 Example |
| Federal Income Taxes | 12%, 22%, 24%, 32%, 35%, 37% | Use 12% or 22% | Use 24% |
| State Income Taxes (NJ) | 3.5%, 5.5%, | Use 3.5% | Use 5.5% |
| FICA Tax with Medicare | 7.65% | Use 7.65% | Use 7.65% |
| Local Property Tax on a $400,000 property (varies) | 10%, 15% | Use 10% | Use 15% |
| Sales Tax (7% of spending) | Calculate as 2% of income | Use 2% | Use 3% |
| NJ SUI Taxes | 1% | Use 1% | Use 1% |
| Total | 36.15% to 55.15% |
- Compare these tax rates to those in a European country or Canada.
- Find the average cost of what a family pays for medical insurance as a percentage of their income.
- Deduct expenses for housing (rent or mortgage), food, vacation, medical, transportation, and savings (10%). How much is left?
Presidents and Congress Have Made Changes to Social Security Over the Decades
The Industrial Revolution sparked the first true need for retirement. Assembly lines and factories demanded constant energy from their workers. Pensions began in the 1800s for older workers to help keep productivity up. But during the Great Depression, older workers didn’t want to leave their jobs — and their paychecks — behind. In turn, FDR designed the Social Security Act, effectively birthing the Social Security program so that older Americans could retire financially. The act is the Federal Insurance Contributions Act (FICA) and was signed in 1935 but didn’t begin payouts until 1940. In 1939, Social Security was expanded to include women. When Social Security became law, workers contributed one percent of their income. Today, they contribute 6.2% and an additional 1.45% for Medicare. Employers match these contributions for a total of 15.3%.
As part of the “War on Poverty,” President Johnson signed the Social Security Act of 1965, which enacted Medicare and Medicaid under the Social Security Administration. In 2018, over 52 million people age 65 and older used Medicare for health insurance.
While President Reagan lowered income taxes, he was the first to make it possible to be taxed on your Social Security benefits in retirement, depending on how much you make. He also raised the full retirement age so that anyone born after 1960 would have to wait until age 67 to receive full benefits. The IRS under the Reagan administration also made it possible to have deductions taken out of employees’ salaries to contribute directly to their 401(k)s — something many workers rely on today.
President Clinton created another level of Social Security taxation, allowing up to 85% taxable benefits depending on how much you make. At the same time, he got rid of the retirement earnings test and prevented the Social Security Administration from blocking retirees from benefits based on earnings.
In 1990, the Older Workers Benefit Protection Act required employers to provide the same benefits for workers over age 65 as younger employees.
In the Unemployment Compensation Amendments of 1992, the rollover rules we know today were implemented. These new rules allowed women who often job-hop to keep their tax-qualified assets protected until retirement.
1993 ushered in the Family and Medical Leave Act (FMLA). This became one of the most important job protections for women after giving birth or providing care for a family member. Now, she could come back to her job and not lose her pay rate.
Although, some consider Social Security as an entitlement, it can be changed by Congress. When workers pay into Social Security, they are contributing to a trust fund instead of a personal account.

Because the combined OASI and DI Trust Funds have accumulated assets of over $2.5 trillion, the excess of program cost over current tax income will be covered by net redemption of these assets in the coming years. It is only when the reserves in the trust funds are exhausted that timely payment of full scheduled benefits becomes an issue. As shown in the chart, at the time of projected trust fund exhaustion in 2037, continuing tax revenue is expected to be sufficient to cover 76 percent of the currently scheduled benefits.
Questions:
- Does the Social Security treat women fairly or equally with men? Do you recommend any reforms?
- Should Social Security benefits be taxed or tax free?
- What will happen to Social Security benefits when the trust fund has insufficient funds?
Treatment of Women in the Social Security System
Senior Citizens’ Freedom to Work Act
Activity #2
- Research the impact of a decision by Congress to make Social Security benefits tax free. Research the impact this will have on the trust fund.
- How does full employment and a sustained period of high unemployment above 7% affect Social Security and Medicare.
- Calculate the amount of money a worker earning $100,000 pays into Medicare over a period of 40 years and the average costs of what Medicare pays for each person today. Medicare Spending and Finance
- How have recent reforms under President Biden affected Medicare spending?
- Discuss the impact of reduced Social Security benefits for people when the trust fund is depleted, around 2033.
How does Social Security Affect the Economy?
When a person receives their monthly Social Security check it is most likely deposited directly into their bank account. This allows it to earn interest immediately and to be used for expenses. Look at the Circular Flow of Money diagram below to see how government money is transferred to households and distributed through the local economy.

For example, whether a person receives a Social Security check for $1,000 or $5,000 some of the money goes to banks (financial institutions) and is used for loans to businesses, homeowners, students, etc., to purchase government bonds to support government spending (including Social Security), and for the bank to pay taxes, its employees, and operational costs. Since part of Social Security income is taxable, the federal government receives some of the money back in taxes. Perhaps the most important influence Social Security has on the economy is that people spend the money locally in supermarkets, stores, and restaurants and it saves the government money by keeping people self-sufficient and out of poverty. This is how money circulates in the economy and creates income for businesses, local and state governments, doctors, and others.
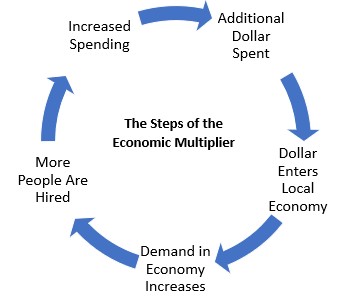
Money also has a Multiplier Effect. The diagram below illustrates the effect of one dollar. As each dollar enters the economy through the purchase of a bagel or donut, the local store expects that sales will continue to increase. As a result, they hire an additional worker, produce more bagels or donuts, and perhaps they will open a second store. As people buy more bagels and donuts, the store needs more flour, butter, cream cheese, coffee cups, etc. The newly hired employee also receives a paycheck for their work and spends it in the community. Basically, think of money multiplying ten times. For each $1.00 spent, the multiplier effect is that it circulated to different people ten times. If the effect of $1.00 is the spending of $10.00 over a month, imagine the impact of a $1,000 Social Security check ($10,000) or a $5,000 Social Security check.
Questions:
- To what extent do government transfer payments (i.e., Social Security) pay for themselves?
- What would be the economic effect on the economy if people at the age of 67 did not receive an incentive (Social Security) to retire?
- Should people be allowed not to participate in Social Security as an employee?
- If Social Security was discontinued, would the effect on the economy be positive or negative?
Activity #3
- Calculate different scenarios if a person should collect their Social Security at age 62, 67, or 70. The scenarios should include individuals who are single, married, in excellent health, divorced, collecting benefits while still working, and for a spouse who did not work and make FICA contributions for the required ten years. Benefit Calculator
How do Private Individual Retirement Accounts Affect the Economy?
According to the Investment Company Institute, “there are more than 710,000 plans, on behalf of about 70 million active participants and millions of former employees and retirees. Savings rolled over from 401(k)s and other employer-sponsored retirement plans also account for about half of the $13.6 trillion held in individual retirement account (IRA) assets as of December 31, 2023.” https://www.ici.org/401k ($13.6 trillion is approximately 1/3 of the federal debt)
The IRA, originally offered strictly through banks, become instantly popular, garnering contributions of $1.4 billion in the first year (1975). Contributions continued to rise steadily, amounting to $4.8 billion by 1981.
The Economic Recovery Tax Act (ERTA) of 1981 allowed for the IRA to become universally available as a savings incentive to all workers under age 70 1/2. At that time, the annual contribution limit was also increased to $2,000 or 100% of compensation.
With the passage of the Tax Reform Act of 1986, income restrictions were introduced, limiting the availability of deductible contributions to the TIRA for individuals with incomes below $35,000 (single) or $50,000 when covered by an employer plan. In addition, provision was made for the Spousal IRA, wherein the non-working spouse could make contributions to a TIRA from the working spouse’s income.
1996’s Small Business Job Protection Act saw the implementation of the Savings Incentive Match Plan for Employees (SIMPLE IRA), which provided for employer matching and contributions to the employee plans, a viable alternative in many cases to the 401(k), although with more restrictive contribution limits.
With the Taxpayer Relief Act of 1997, the Roth IRA was introduced. In addition, phase-out limits were increased, plus the distinction was added for limits on deductible contributions if the taxpayer was covered by an employer-provided retirement plan. The Education IRA was also introduced, with features similar to the Roth IRA (non-deductible but tax-free upon qualified distribution).
In 2001 the Economic Growth and Tax Relief Reconciliation Act (EGTRRA), increased contribution limits with a “catch-up” provision for taxpayers aged 50 and older. An additional provision was the option to convert funds from a Traditional IRA to a Roth IRA, regardless of income level.
The Consolidated Appropriations Act of 2016 finally made Qualified Charitable Distributions (QCDs) permanent. This feature applies to individuals age 70½ or older and subject to Required Minimum Distributions. The Qualified Charitable Distribution allows direct distributions to charitable organizations (houses of worship, non-profit organizations, etc.) from their IRAs without having to include the amount of the distribution in gross income for the tax year. In 2019, the age for Required Minimum Distributions was changed to age 73½.
As of the most recent reports from 2021, the Investment Company Institute indicates 37% of all American households own an IRA account of some type (over 48 million households). Approximately 27.3 million households have a Roth IRA, holding roughly $1.3 trillion in assets, while traditional IRA are owned by 36.6 million households, holding approximately $11.8 trillion.
Questions:
- How will the taxes paid by retirees on their IRA distributions affect the federal budget and national economy?
- How does the flow of money from current workers contributing to their Individual Retirement Accounts affect investment firms and the stock market?
- Should Social Security and Individual Retirement account changes be allowed or should changes only apply to people who are working and not retired?
- Should anyone not participating in the labor force because they are caring for someone in their home be allowed to contribute to Social Security or an Individual Retirement Account?
- Should money in an IRA account be allowed to be deposited in a traditional bank savings account of CD that is insured by the Federal Deposit Insurance Corporation?
- Should Individual Retirement Accounts replace Social Security for anyone who has not started paying FICA taxes?
